New US Birth Data vindicates Breeder Selection Theory (Mini-White Baby Boom)
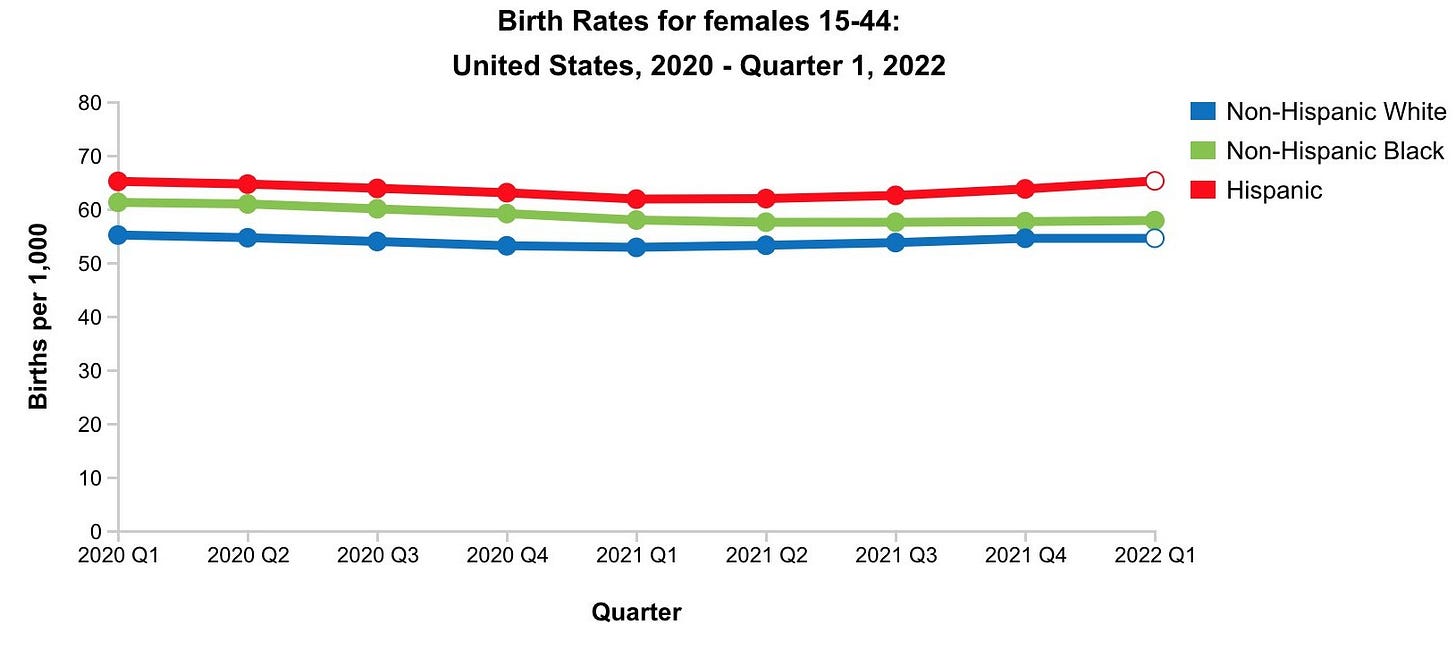
US births have been consistently declining since 2014, but actually increased from 3,613,647 in 2020 to 3,659,289 in 2021. White births increased by 2.2% (from 1,843,432 to 1,884,554), Hispanics birth by 2% (from 866,713 to 884,726), Black births declined -2.4% (from 529,811 to 517,027), Asian births declined by 2.5% (from 219,068 to 213,556), and Native American births declined by -3.3%. From April 2021 to March 2022, the total US birth rate rose from 1.66 to 1.68, non-Hispanic Whites were steady at 1.60, non-Hispanic Blacks steady at 1.68, and Hispanics rose from 1.90 to 1.95. From 2020 to 2021, total US fertility was steady at 1.64, non-Hispanic Whites increased from 1.55 to 1.57, non-Hispanic Blacks declined from 1.71 to 1.67, and Hispanics declined from 1.88 to 1.86.
Many were expecting a pandemic baby bust but overall the pandemic had less of an impact on fertility than anticipated. While the increase in White fertility was modest, it contradicts a lot of the demographic doom and gloom narrative. The slight increase in White fertility appears to be more among affluent Whites, and my personal observation has been of an increase in pregnant White women in affluent areas in California. This trend is likely due to remote work benefiting upscale Whites more than other groups, enabling mothers to stay at home with babies and those moving from cities to more family oriented suburban areas. An increase in older mothers having more children at the margin could also be a factor. Latinos were disproportionately impacted by the pandemic and there was initially a dip in Latino fertility. The recent rise could be a recovery from the pandemic decline, plus the recent surge in foreign migration. Urbanization tends to suppress fertility, and the Asian and Black fertility decline, reflects that those two groups are heavily urbanized.
Source: Wall Street Journal report Behind the Ongoing U.S. Baby Bust
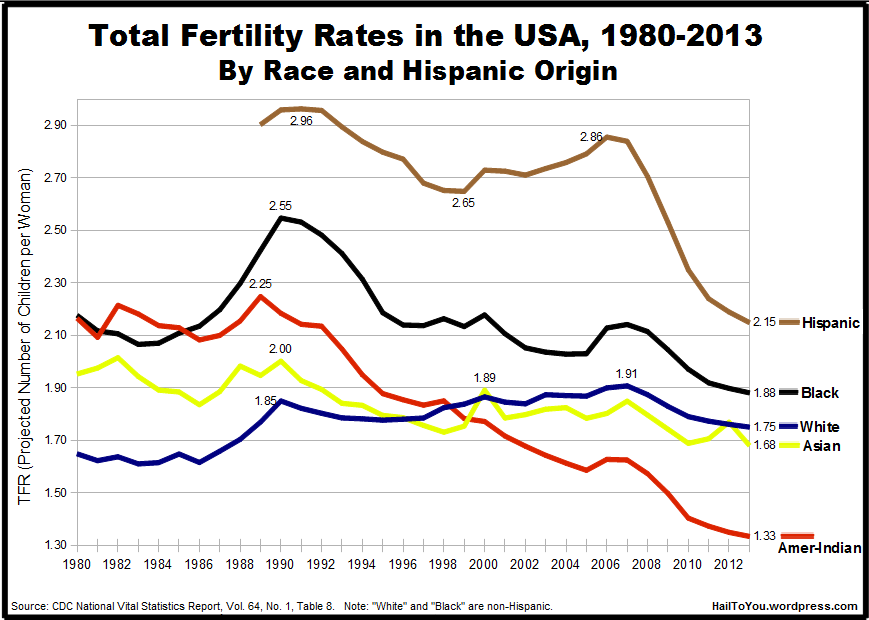
US Non-Hispanic White births at 1,884,554 in 2021, are still numerical lower than 2,056,332 in 2016, and 2,162,406 in 2010. White births also declined 10.35% from 2016 to 2020, ironically under MAGA years. Non-Hispanic White births briefly lost majority status around 2010-2011 but then recovered to 54% of total births by 2013, declined to 51.7% in 2016, but were still at 51% in 2021. White fertility has been below replacement since the early 1970s baby bust, bottoming out at 1.61 in 1983. However, there was a recovery in White fertility in the 80s and 90s, when boomers had families, peaking at 1.91 in 2007. Then there was a gradual decline to 1.71 in 2016, reaching a low point of 1.55 in 2020, and then bouncing back to the current TFR of 1.6. While Whites are still hemorrhaging population by having below replacement fertility, their overall rate, which is still higher than that of most developed nations, has been remarkably stable. Whites have maintained fertility proportions close to 50% without a major drop, which is decent taking into account that immigration is overwhelmingly non-White.
The 884,726 Hispanic births in 2021, were a substantial decline from 918,447 in 2016, and from 945,180 in 2010. Hispanics births also declined by 5.63% from 2016 to 2020. Hispanics fertility was 2.96 in 1990, remained fairly high throughout the 90s and into the 00s, then declined sharply after the 08 housing bubble crash, which impacted Hispanics much more than other groups. Hispanic fertility was at 2.09 in 2016, and then dipped below replacement in the late 2010s, reaching 1.95 today. There is a disparity between native born Hispanic fertility at 1.71 and foreign born at 2.18 (2019) but also a much bigger decline in foreign born fertility, that is converging with native rates. An American Community Survey from 2015 to 2019 placed those of Mexican ancestry at 1.84, while the highest fertility Latino ancestry groups were Guatemalans at 2.58 and Hondurans at 2.67, though likely significantly lower today.
Black births declined to 517,027 in 2021 from 558,622 in 2016, and from 589,808 in 2010. Black births also declined by 5.16% from 2016 to 2020. Black fertility was high in the late 80s to early 90s, peaking at 2.55 in 1990, and then declining throughout the 90s, to below replacement level, and coming close to converging with Whites rates around 2000. Black fertility had a small rebound in the mid-00s, followed by a dip around the 2008 crash, and has been below replacement throughout the 2010s, from 1.90 in 2016 to 1.68 in 2021. Foundational Black American Fertility was at 1.65 in 2019, while Black immigrant fertility was at 2.20. Foundational Black fertility is now at about 1.6, which is tied with Whites. The American Community Survey from 2015-19, placed African American fertility at 1.84, but Somalis at 4.32, Haitians at 2.23, and Nigerians at 2.44. Sub-Saharan Africa has the highest fertility in the world and African immigration increasing in the future could compensate for the decline in American Black fertility.
Asian births declined from 254,471 in 2016 to 213,556 in 2021, and declined by 13.9% from 2016 to 2020. Asian fertility was at an abysmal low at 1.38 in 2020, and is now likely even lower. The Asian fertility rate was 2.0 in 1990 and has been below replacement level ever since. Asian fertility plateaued from the mid 90s until a drop off in the late 00s and 2010s. Considering that Asian Americans are the fastest growing racial group, even factoring in growth from immigration, the decline in Asian births is remarkable. If immigration were cut off, Asian population would rapidly decline. Foreign born Asian TFR was at 1.63 and native born was at 1.30 in 2019. The American Community Survey from 2015-19 shows Asian fertility the highest among Hmong at 3.23, Burmese at 2.69, Nepalis at 2.63, Indians in the middle at 1.72, and the lowest rates were for Chinese at 1.55, Taiwanese at 1.49, Korean at 1.40, and Thai at 1.27.
Native American fertility fell from 31,452 in 2016 to 26,813 in 2020, and declined by 14.75% from 2016 to 2020. Native American fertility has declined the most among any group over a long period of time, which is devastating considering the high out-marriage rate.
The states with the fastest declining fertility in 2021, including DC (-7.6%), were New Mexico (-5.1%), California (-4.1%), and Arizona (-4.0%), which are also the most heavily non-White, and except for DC, the most Latino. The states with the greatest increase in fertility were New Hampshire (+4.8%) and Idaho (+3.1%), which are also disproportionately the Whitest. In California, White births declined from 143,531 in 2013 to 115,543 in 2020 (19.4% decline), in contrast with Hispanics from 238,496 to 194,295 (18.5% decline), Asians from 76,424 to 58,543 (23.3% decline) and Blacks from 31,977 to 21,350 (33.2% decline). California had a significant decline in White births, but about the same rate of decline as Hispanics and a much lower rate of decline than for Blacks and Asians, which is overall not bad taking into account immigration trends and White flight out of the State.
A lot of racial stereotypes about fertility are outdated. In fact fertility is now declining the most among non-White women. There are parrels to Brazil’s fertility decline, which is driven by non-White rates converging with White rates. Non-Whites are still growing more than Whites numerically and have higher fertility rates but are also declining at a faster rate than Whites, whose fertility shows signs of stabilization and recovery. There are limitations to relying upon past trends to predict the future, as all groups are undergoing fertility transitions at different rates. There is even speculation that Whites are at a long-term advantage over other groups by undergoing their fertility transition earlier, even though they hemorrhaged a lot of their population, which the recent albeit modest bump in White fertility points to. If immigration were shut down, then Whites could be at a long-term demographic advantage over non-Whites.
There is a hypothesis that fertility is heritable, based upon inborn genetic traits rather than external social factors. Since modern society has many anti-natalist selection pressures, those who are not genetically selected to want children are being shredded from the gene pool and the genes of those who are wired to reproduce more will become more pronounced in future generations. In the past, the lack of birth control and social pressure to reproduce meant that almost everyone reproduced regardless of genetics. The theory predicts that the selection for fertility means that fertility will rise in the future among demographics that declined first, and thus have an advantage over groups that underwent the cycle latter.
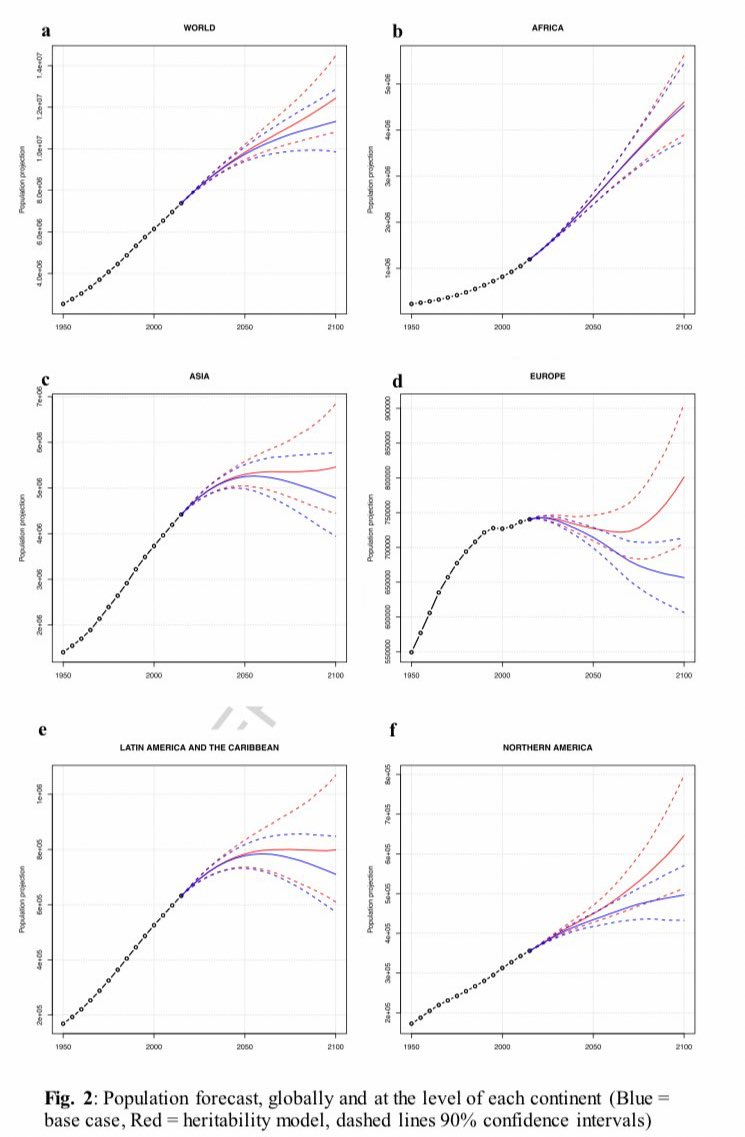
There is extensive data to back up this hypothesis, such as Jason Collins and Lionel Page’s research for the Institute for Family Studies that accounts for heritable fertility preferences. A Forbes article states that their research theorizes that “as soon as individuals exercise choice over how many children they wish to have, then fertility does become heritable.” Lionel Page states that “The argument is straightforward: countries will likely experience a rebound in fertility after the demographic transition because new generations are from family with higher fertility & fertility is heritable,” and that “We should expect fertility to rebound in developed countries which have completed their demographic transition, like in North America and Europe.”
Corrected population predictions (red) vs standard UN predictions (blue)
Source: Lionel Page
The Forbes article states that the research by Collins and Page “calculates that the world fertility rate, which now stands at 2.52 (as of the period 2010 - 2015) and is forecast to drop to 1.83 in 2095 - 2100 in the baseline UN forecast, will, in fact, continue to drop, but eventually, as this evolutionary impact comes into play, birth rates will rebound to slightly above replacement level, at 2.21. At a regional level, European fertility rate is forecast to reach 2.46 instead of 1.83, and North American fertility, 2.67 rather than 1.85.” Until this study, most mainstream fertility projections, including the United Nations’, assumed that the trend of fertility decline will continue indefinitely.
Russian blogger Anatoly Karlin has also written extensively about fertility being hereditable, pointing to charts that show that “actualized fertility tends to lag desired fertility by approximately 0.5 children.” Karlin also points out that Haredi Jews in Israel, who have a TFR of 7, live in a very densely populated environment that would usually be bad for fertility. The Twitter account Birth Gauge’s research on the theory assumes a heritability of fertility for Finland at +0.32 children per generation, Canada +0.27, USA +0.27, Japan +0.27, Germany +0.26, UK +0.25, Spain +0.22, France +0.22, Sweden +0.21, Italy +0.21, Russia +0.19, Czechia +0.19, South Korea +0.19, and Portugal +0.17. This data predicts a higher long-term fertility rate for Canada, Japan, and Germany, even if these nations currently have low fertility.
Anatoly Karlin’s strongest case for the theory is historic trends in Europe, contrasting France, which was the first major European nation to undergo demographic decline, and went from being Western Europe’s most populated nation in the 18th to 19th Century, but was surpassed by Germany. However, today France has much healthier fertility than other European nations such as Germany, which underwent the transition much latter. Karlin also points to Russia which had a fertility rate of 1.1-1.3 after the fall of the Soviet Union but then peaked at 1.8 children, a couple of years ago, though recently declined to 1.6. Of all European nations, Czechia had the most notable rebound in fertility, falling from 1.1 at the fall of Communism to about 1.8 today. Another success story is Denmark whose TFR rose from 1.38 in 1983 to 1.72 in 2021. This year, the only EU nations to buck the trend of fertility decline are Romania, Bulgaria, and in France, where births were up 2.2%, in the first half of 2022, from 2021. One of the biggest declines in Europe, has been in the UK, where until recently had much higher fertility than most of Continental Western Europe, which shows how the UK is late to go through the transition.
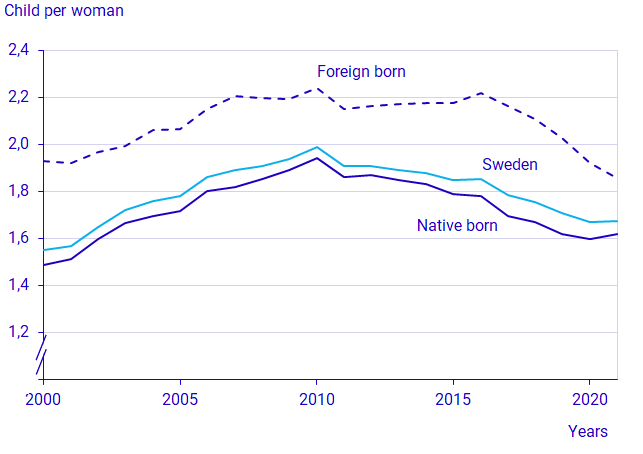
Even factoring in the differences between native vs. immigrant fertility, most of the fertility increase in France was in rural areas, especially in the South and West, that are populated by native French. The biggest decline in France’s fertility was in the immigrant heavy suburbs of Paris. Fertility is generally higher among immigrants than natives in Europe, with a few exceptions such as Iceland and Denmark, where it is close. However, in many European nations, foreign fertility is declining at a much faster rate than among natives. For instance in Sweden, immigrants still have substantially higher fertility than natives but are converging with native fertility rates. The native Swedish rate actually grew more despite high levels of immigration. Also in Belgium, fertility rose from 1.43 to 1.49 for citizens from 2020 to 2021 but declined from 2.13 to 2.11 for foreigners. Even in Germany, births briefly increased for German mothers, but declined for foreign mothers, though native births have declined more recently.
Sweden: Native vs. Migrant fertility


Really interesting article.
But the analysis of European fertility seems flawed.
Births to foreigners vs native born births is very limited as a metric. It takes no account of the fact that many births in the latter category are not to Europeans.
Portraying a rebound in 'native' births that, in the case of Belgium for example, could easily be 30-40% North African is misleading.
What explains the huge discrepancy between American Indian fertility (the lowest of any group) and Canadian Indigenous fertility (the highest of any group)?