2020 Census: In-Depth Analysis of LA’s Demographic Trends
The 2020 Census shows that the City of Los Angeles’s population grew by 2.8% from 2010 to 2020, with a population just shy of 4 Million at 3,898,725. Los Angeles County’s population is now at 10,014,009 residents, adding 195,404 people over the past decade. LA’s growth rate is much lower than in previous decades and well below the State’s average of 6.1%. At 2%, Los Angeles County had one of the lowest growth rates of any California county, in contrast with much more densely populated San Francisco County, that grew by 8.5%. It is noted that since the census, the LA Metro’s population actually declined by 67,000 people from July 2020 to July 2021.
LA County’s racial makeup has changed over the past ten years, with Asians dominating growth, adding 153,119 residents and growing in share from 13.50% to 14.7%. The Latino population grew more modestly by 116,874, from a share of 47.7% to just shy of a majority at 48%. Both LA County’s White and Black populations have continued to decline, with the White share going from 27.79% in 2010 to 25.6% in 2020 and the Black share from 8.73% to 7.9%. LA County’s population has also rapidly aged, with the over 65 share rising to 14.1%, from 11% in 2010, while the population aged 5-19 is at 18%, a decline from 20.9% in 2010. California’s senior population was already expected to double from 2015 to 2030 and LA schools have been hit hard by declining enrollment. Despite LA becoming older and more non-White, the census shows that wealth has actually increased over the past decade.
LA Metro Population Growth
Source: Darrell Owens’ interactive map
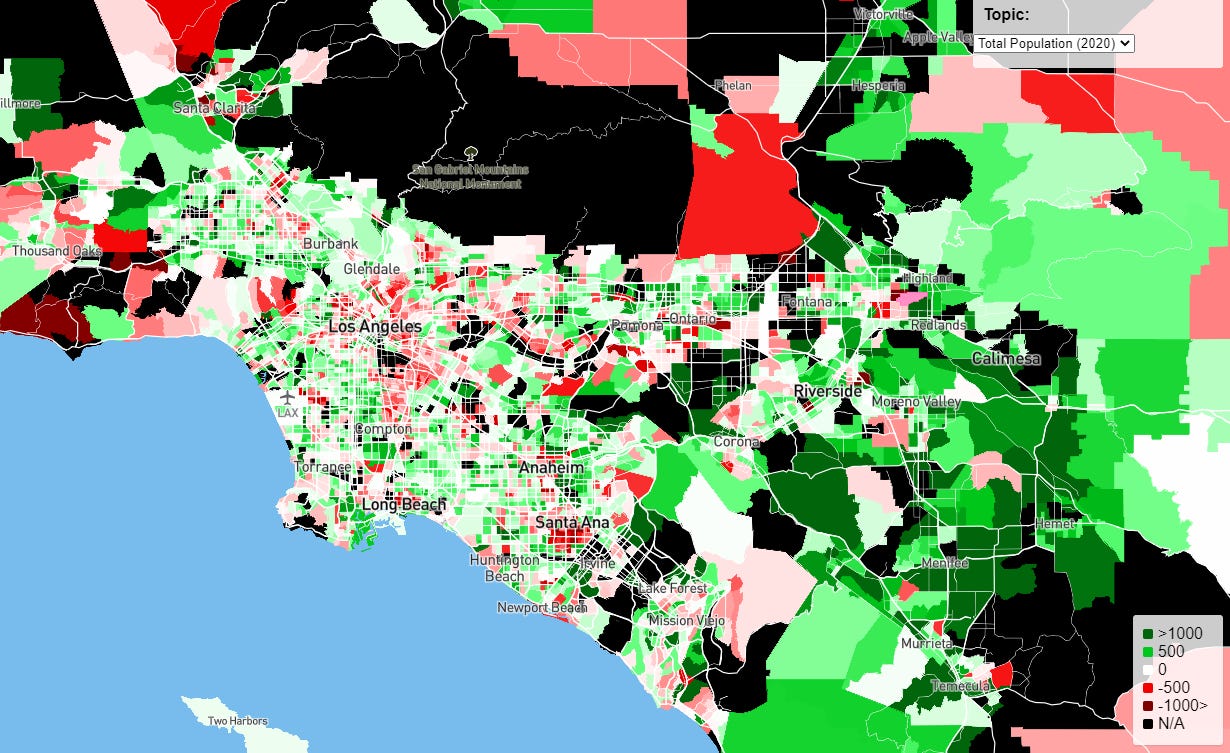
While these census maps may be somewhat dated, they offer a good assessment of LA’s demographic trends. LA’s fastest growing neighborhoods from 2010 to 2020 were Playa Vista (90% growth), Downtown (57%), Century City (23%), Chatsworth (15%), and Woodland Hills (13%). The map shows overall growth in much of LA’s Westside, the Western San Fernando Valley, and many of the newer suburbs beyond the City of LA.
The swaths of population decline in LA’s metro are far greater than that for the SF Bay Area, with huge pockets of decline throughout LA’s urban core, and in urban and suburban, and low income and wealthy areas alike. There is an overall declining population on LA’s Eastside and much of the urban core with the LA neighborhoods that experienced the worst decline from 2010 to 2020 being Cypress Park (13% decline), Elysian Valley (11%), East Hollywood (10%), Chinatown/Solano Canyon (9%) and Highland Park (7%). The urban core’s decline could be because of gentrification displacing multigenerational low income households but could also be a sign of the urban exodus. Also there was likely undercounting, especially among undocumented immigrants.
Unlike the Bay Area, even many of LA’s wealthiest areas experienced population decline. Not just for Whites but overall population decline. This includes much of Malibu, much of Beverly Hills, and Bel Air, and even pockets of decline in the wealthy suburbs of Calabasas, Palos Verdes and Newport Beach. Many people might say good riddance, less people equals less traffic, but population decline is often a sign that a city or region is stagnating and losing its dynamism.
LA Metro White Growth
Source: Darrell Owens’ interactive map
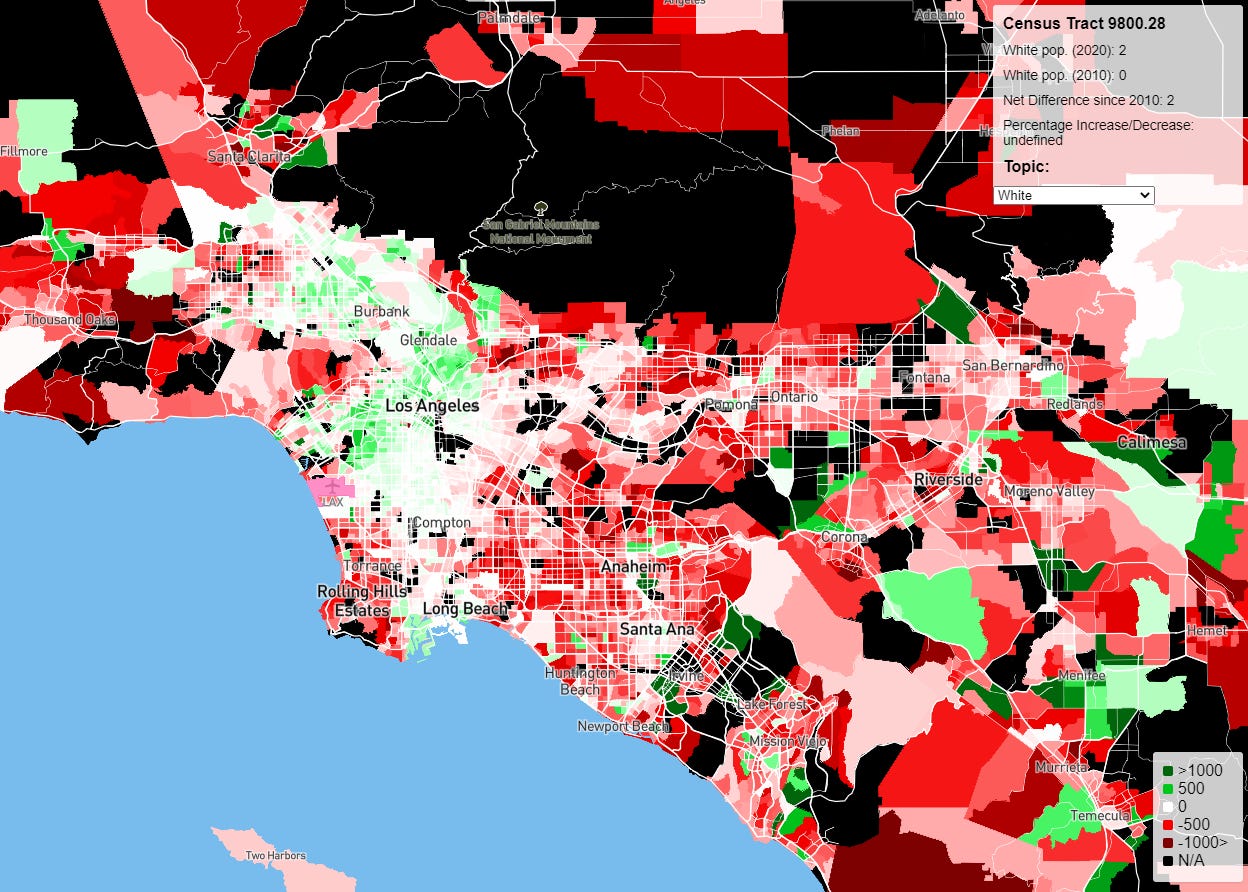
Despite an overall trend of decline, the White population did grow in much of the Westside, including Century City, parts of Westwood, parts of Santa Monica, and parts of West LA, mostly in areas with lots of new luxury construction. There was also White growth in the Orthodox Jewish areas South of Beverly Hills and Hancock Park, and an especially high concentration of White growth in the historically well of Black area around Ladera Heights and Windsor Hills, as well as in areas undergoing gentrification. These gentrifying areas include the southern portion of the Mid-City, much of Culver City, LA’s urban core including Koreatown and Downtown, much of the Hipster corridor to the Northwest and Northeast of Downtown, the Southeastern San Fernando Valley, and San Pedro. Beyond LA, there was White growth in Downtown Pasadena and neighboring Altadena, Burbank, Downtown Long Beach, Anaheim’s Platinum Triangle, and some newer subdivisions in pockets of Santa Clarita and Moorpark in Ventura County, pockets of exurban Temecula, Beaumont, Lake Elsinore, and Menifee, in the Inland Empire, and in the far southern end of Orange County, around Rancho Santa Margarita and Ladera Ranch.
Areas of White decline in LA, include much of the Western San Fernando Valley, except for pockets of new construction at Warner Center and the subdivisions of Porter Ranch, and especially severe White decline in Malibu, with 30% decline in a major census track. On the Westside, White decline was generally worse in the hills and single family home areas, including much of Beverly Hills but also much of West Hollywood. In the suburbs beyond LA, there was White decline in much of Ventura County, much of the very affluent Conejo Valley, the traditionally White parts of the Pomona Valley, including Glendora, San Dimas, and Claremont, the traditional White flight suburbs of the South Bay and La Crescenta Valley, most of the heavily Asian San Gabriel Valley, and in the diverse and mixed income Gateway Cities of Southeastern LA County.
The same donut hole trend is notable in LA, as in the SF Bay Area, where most White growth is in the urban cores but also new subdivisions, while the worst White decline is in inner-ring suburbs that have little to no new construction. For instance on LA’s affluent Westside, the more urban parts saw White growth while the single family home areas saw the worst decline. This trend is also noticeable in Orange County, where there was White growth in areas of urban development such as Irvine and Anaheim’s Platinum Triangle, but also the newer subdivisions in South County. Everywhere else in Orange County is losing White population, including the wealthy coastal areas of Newport Beach and Laguna Beach, and the traditional White Flight zones of Yorba Linda and Huntington Beach. In the suburbs of the Inland Empire and Santa Clarita we see this choppy pattern where White growth is relegated to new construction on the periphery. This donut hole effect shows that White growth is especially dependent upon new construction, and that inner-ring suburbs with single family homes that have little to no new construction are especially vulnerable to White dispossession. LA’s fastest growing neighborhoods tended to see White growth, but Chatsworth and the West Valley in general, had strong growth overall but White decline.
The White decline in affluent areas debunks the notion that wealth always uplifts a community and that even wealthy communities are vulnerable to demographic decline if they don’t plan for their futures. It is notable that LA’s Westside is doing much better demographically than many desirable suburbs such as the South Bay and the Conejo Valley, even taking account the Westside is part of LA’s subpar school district. Like with the Bay Area, there is a trend of Whites growing in urban cores while the suburbs are becoming more non-White. However, many of these younger urban Whites are more transient and could move to the suburbs or out of the LA metro as they get older. The formula for strong White growth is generally good schools plus new market rate construction, a rare combo in the LA metro.
Another factor to take into account is the demographic impact of ethnic White communities such as Armenians, Iranians, and Orthodox Jews. While I don’t have a breakdown of the White population by ethnic background, it appears that Armenian immigration plus gentrification has helped maintain the White population in the Eastern San Fernando Valley. The same trend is noticeable with Orthodox Jewish neighborhoods, even those that are mostly single family homes, such as Beverlywood and Hancock Park. The heavily Iranian areas of Westwood, Beverly Hills, and the Southwest San Fernando Valley were a mixed bag as far as White growth. It is hard to say the degree to which these ethnic White communities have grown and compensated for the overall White decline. It is also noted that many people changed their census classification from White to Hispanic, which may make the White decline appear worse than it actually is.
LA Metro Latino Growth
Source: Darrell Owens’ interactive map
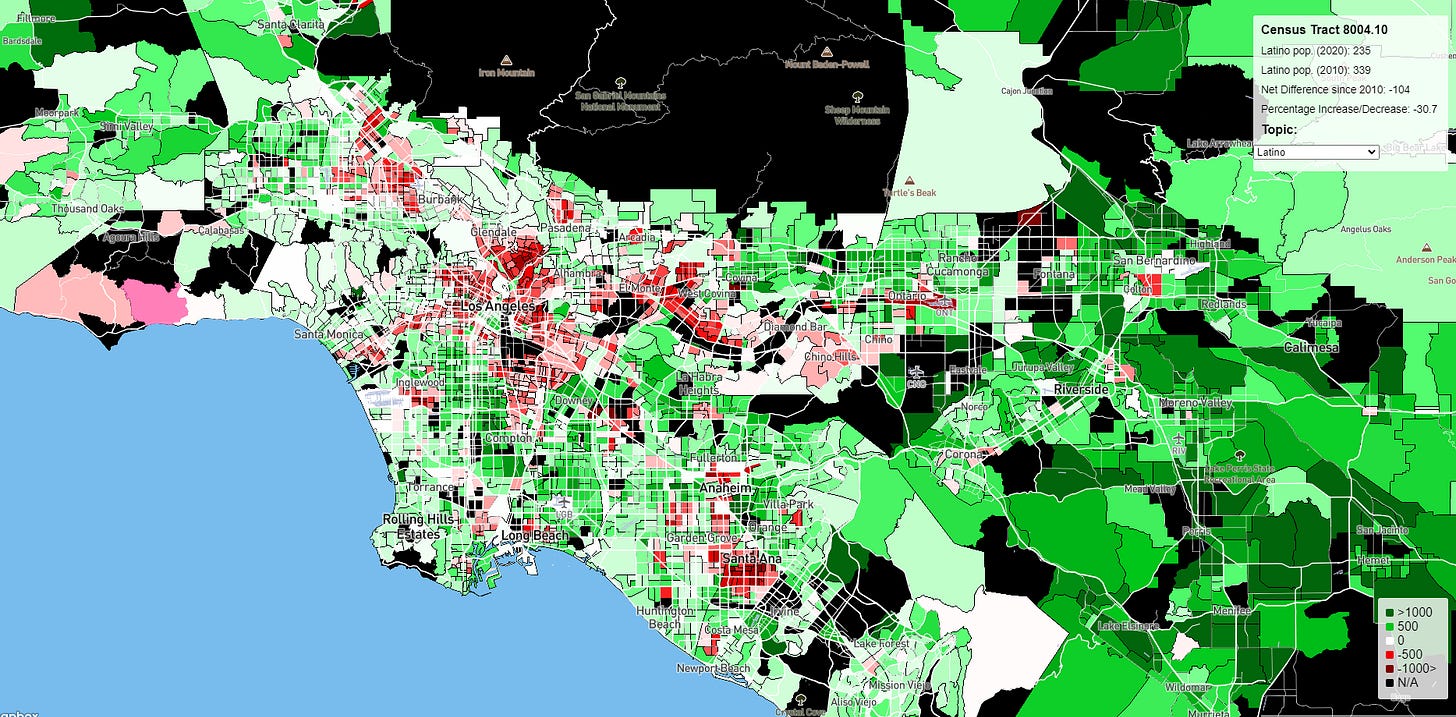
While White growth follows a donut hole pattern, Latino growth is strongest in the exurbs, with more modest growth in the inner-ring suburbs, and declining in many of the urban cores where the White population grew the most. The Latino population had strong growth in the historically Black areas of South LA, most of Orange County except heavily Latino Santa Anna, and many suburbs such as San Dimas, Santa Clarita, and much of Ventura County. Overall Latino growth was strongest in the Inland Empire.
While there is still a perception of booming Latino population growth, this is no longer the case for much of LA. There was significant Latino decline in most of LA’s urban core, especially in areas which have undergone gentrification such as East Hollywood, Echo Park, and Highland Park, but also in poorer areas adjacent to Downtown. The Latino population did grow in the core of Downtown, as the massive degree of new construction raised the numbers for all racial groups.
There were many cases where the Latino shift was the opposite of the White shift. For instance on LA’s Westside, the gentrifying, traditionally working class and apartment areas, such as much of Culver City, Mar Vista, Venice, and Sawtelle, gained Whites but lost Latinos. On the other hand the affluent single family home areas on the Westside that lost Whites, had modest Latino gains. A similar trend is notable in the San Fernando Valley, where there was a big decline in the historically Latino East Valley, which gained some Whites. There was a shift in the Latino population to the more middle class West Valley, especially the Northwest Valley around Chatsworth, a longtime White stronghold that is loosing Whites. In the San Gabriel Valley, Baldwin Park and El Monte both had some of the biggest Latino declines in the entire Nation, with El Monte as an example of a Latino area transforming into an Asian ethnoburb. The overall trend is a massive shift in the Latino population to the Inland Empire and away from the urban core, except for the substantial Latino growth in historically Black areas. This is the first census where there was a significant amount of areas with Latino decline and it would not surprise me if the 2030 census shows overall Latino decline for both the City and County of LA, as Latino immigration and fertility rates are declining and there is an exodus to more affordable metro areas.
LA Metro Asian Growth
Source: Darrell Owens’ interactive map
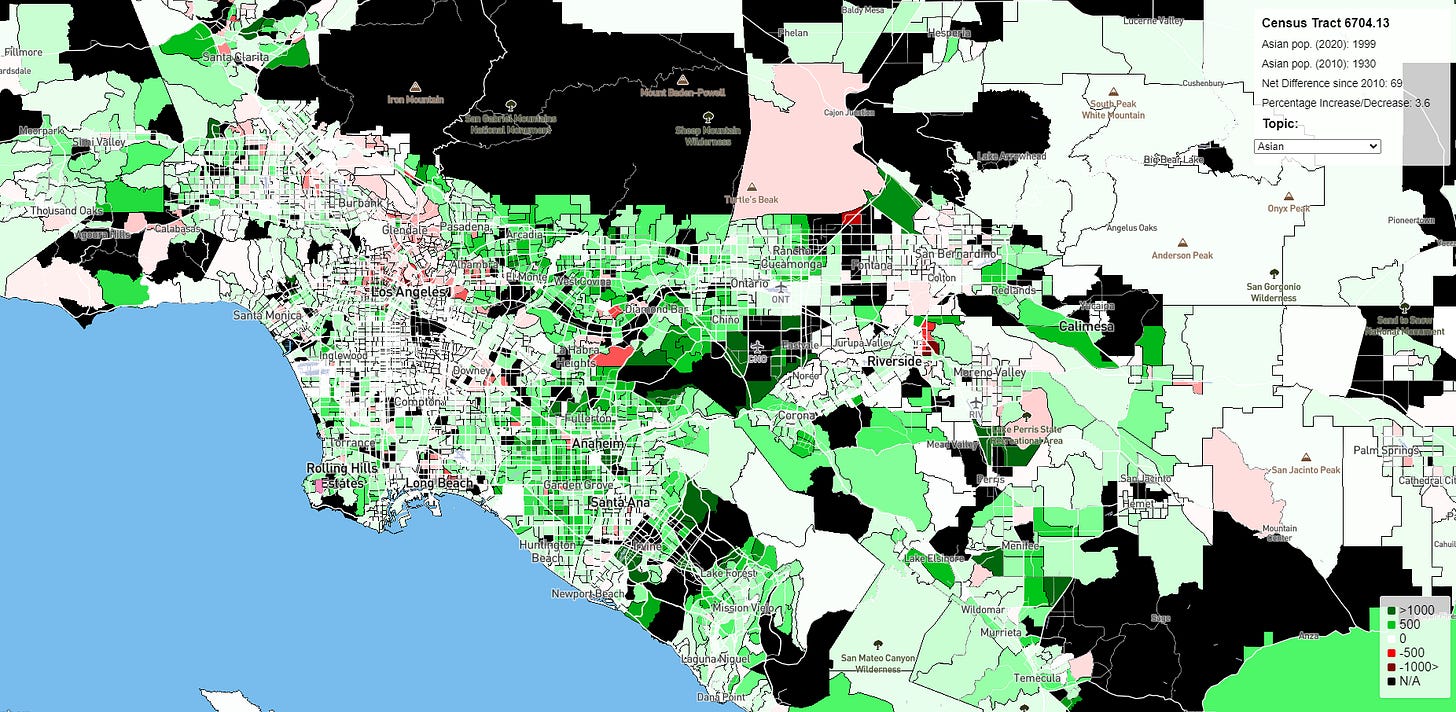
Asians were LA’s and California’s fastest growing racial group and had the overall strongest growth in the suburbs. The strongest Asian growth was around Diamond Bar, and Chino and Chino Hills in the Inland Empire, and most of Orange County, especially Irvine and the North Eastern end of Orange County. There was also Asian growth in Pasadena, La Crescenta Valley, the South Bay, and the San Gabriel Valley, with growth spreading east into traditionally more White and Latino areas, such as El Monte, West Covina, Glendora and La Verne. The Asian population growth was more modest in the San Fernando Valley but there was strong growth in the West Valley around Chatsworth and Porter Ranch. There was Asian growth on LA’s Westside, albeit more modest than the suburbs, with a pocket of strong growth around Westwood/UCLA. Like the Bay Area, the Asian population is becoming more suburban, with strong growth throughout the suburbs, including areas that have historically had modest Asian populations such as much of Ventura County and Santa Clarita.
The Asian population declined in much of LA’s urban core, except for pockets of Koreatown and Downtown that had lots of new construction. There was decline in most of the areas surrounding Downtown, including Chinatown, East Hollywood, the Hipster Corridor including Echo Park, and much of Koreatown. There was also Asian decline in Glendale and much of the Southeastern San Fernando Valley and pockets of the Westside, and in Malibu and Calabasas.
Koreans have long been the dominant Asian demographic in LA’s urban core and now have more modest levels of immigration and an exodus to the suburbs. In contrast, the fastest growing Asian demographics, Chinese and Indians, tend to have very strong suburban preferences. Asians tend to place a strong emphasis on quality schools and LA having poor quality public schools seems to be stifling the Asian population growth in the City of LA, despite the strong growth for the metro.
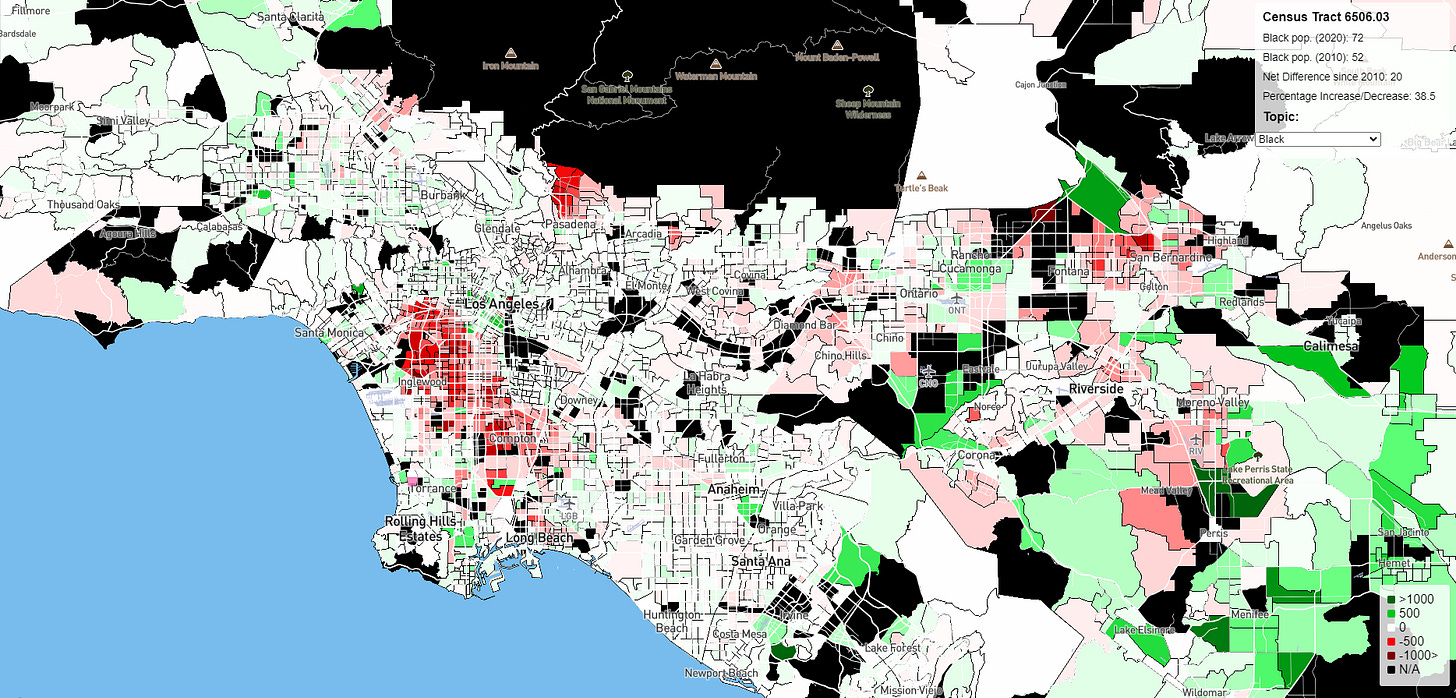
LA Metro Black Growth
Source: Darrell Owens’ interactive map
LA’s Black decline was especially dramatic in the historic Black core of South LA. There has been some Black growth in Downtown LA, due to lots of new construction but most of the Black growth has been in the Inland Empire and the exurbs in the Mojave Desert. The overall Black demographic trend is decline in LA’s urban core plus South LA, stagnant in most of the Westside, San Fernando Valley, and other inner ring suburbs, and strong growth in the exurbs. Historic Black LA has been impacted by both gentrification and a dramatic increase in the Latino immigrant population and large numbers of Blacks are leaving LA for cheaper metros.

People around here always talk bad about downtown but 57% growth in population in 10 years is incredible. Second best in the entire city.