To truly understand demographic trends within California, a local breakdown gives the most in depth and accurate portrait, as California is a patchwork of many sub-regions and enclaves. This especially applies to the San Francisco Bay Area where Berkeley resident Darrell Owens has published an interactive map that lets you zoom into any census tract to see localized demographic changes.
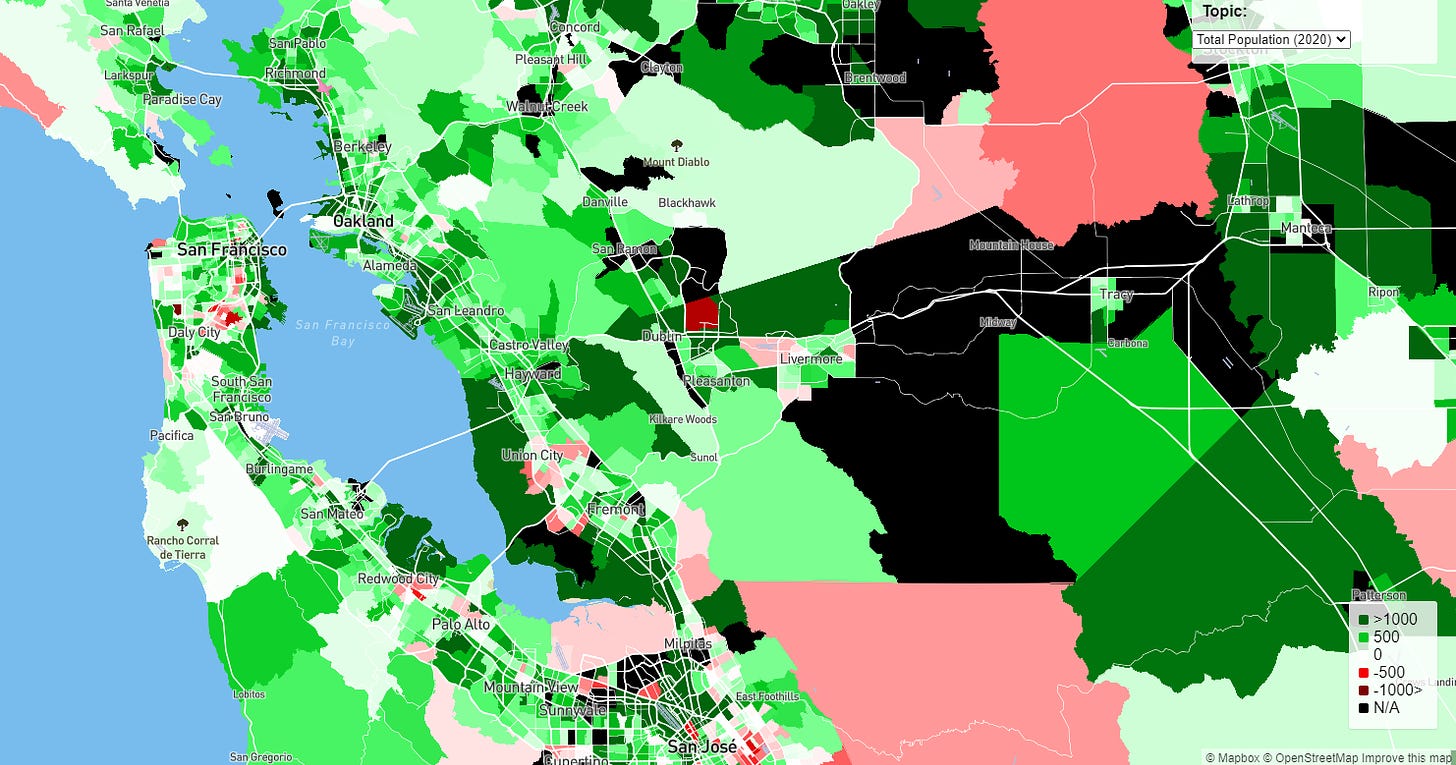
San Francisco Bay Area Population Growth
Source: Darrell Owens’ interactive map
California’s overall population, which is just shy of 40 Million at 39,538,223 residents, grew “by 6.1% over the last 10 years, a slower pace than in previous decades.” Despite the hype of a mass exodus, the nine-county Bay Area population grew 8.6% from 2010 to 2020, a growth rate higher than the State’s average, with every Bay Area county seeing its population grow. The Bay Area’s fastest growing counties were Alameda and Contra Costa at about 11% growth each.
The map shows that most Bay Area regions either saw population growth or at least kept a stable population. Even though the census data doesn’t reveal the full scope of the pandemic exodus, there was more of a population shift to the suburbs rather than out of the region altogether. Even then, urban areas with lots of newer infill construction such as Emeryville, Downtown San Jose, and the Southeastern Waterfront of SF saw significant growth, along with sprawling suburban cities such as Dublin in the East Bay and Morgan Hill on the periphery of the Silicon Valley. Outliner areas that experienced population decline include working class Latino areas undergoing gentrification such as East San Jose, and much of SF’s Mission District. I was expecting wealthier single family home areas to see some decline, but with some exceptions, most of the wealthiest areas saw modest growth or at least were stable. It is also notable that SF has become dramatically more childless over the past decade, mirroring California’s overall plummeting fertility rate.
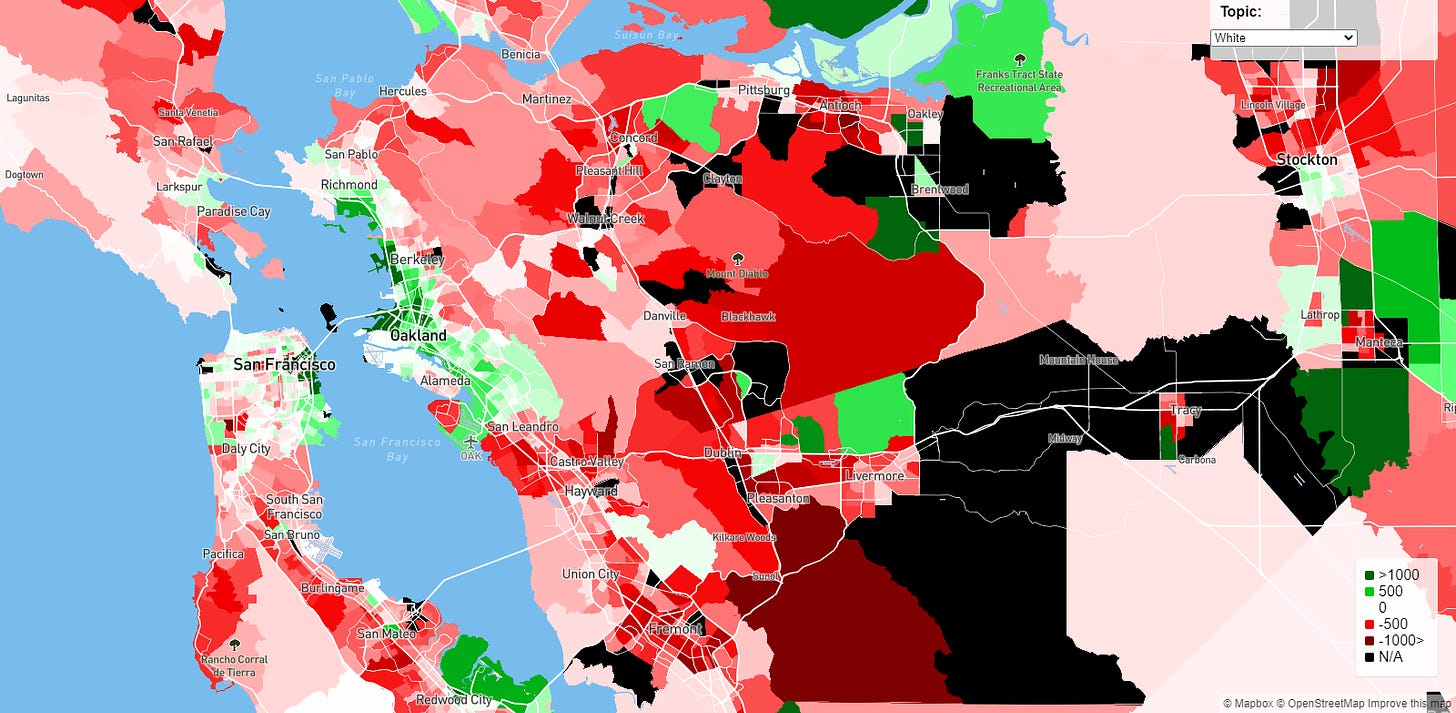
Bay Area’s White Population Growth
Source: Darrell Owens’ interactive map
Over the past decade California’s White population plummeted by 24% and the percentage of White residents fell in all Bay Area counties but Whites remain the largest racial group in Contra Costa, San Mateo, San Francisco and Marin counties. The SF metro’s White population declined by -122,317 and the San Jose metro’s by -72,570. While the White population declined in most of the Bay Area, including in the wealthiest areas, the census tracks that stand out for having White growth are primarily found, not in traditional White flight zones, but rather in urban cores. This includes much of the Southeastern portion of SF, with especially impressive White growth in the mega developments of Mission Bay and South of Market, much of SF’s Westside, much of the urban East Bay including in Oakland, Berkeley, and especially Emeryville, and Downtown San Jose, all areas with either lots of new construction or are undergoing gentrification. This other map from Darrel Owens shows that the most White growth was in areas that are the least White proportionately. There was also White growth in certain exurban areas with lots of new sprawl construction, including much of Morgan Hill, Brentwood, and Vacaville, as well as suburban pockets in Petaluma, Pittsburg, Dublin, San Ramon, and around Larkspur and Corte Madera in Marin.
In contrast to White positive urban cores and far out exurbs, the worst White decline was in inner-ring suburbs with little to no new construction. Unlike the White positive urban core of Alameda County, there was especially severe White decline in Alameda County’s southern portion, including the inner-ring suburbs of San Leandro and Fremont as well as in the affluent suburb of Pleasanton, historically a White Flight zone that is in the process of transforming into an Asian ethnoburb. The one exception in Pleasanton was a pocket of new construction.
A 20% or more White decline is a sign that an area is undergoing a major demographic dispossession or transformation. This trend is especially evident in Silicon Valley’s Asian ethnoburbs such as Cupertino. The White decline is a combination of rapid non-White growth on top of restrictions on new housing limiting the supply. A range of 5-12% White decline, which is more modest than the state’s average, is standard for wealthy White single family home areas that are not undergoing a dramatic shift. This includes much of Marin County, the Peninsula and Central Contra Costa County. Besides Asians making inroads into traditionally White strongholds, White families downsizing to empty nesters is responsible for the decline.
In very White Central Contra Costa County, the White population is declining in most areas without new construction but is close to stable in a track of Orinda with a massive new housing development and in tracks around Downtown Lafayette and in nearby Saranap that have infill developments. In the fast growing suburb of San Ramon, which has trended Asian, we see White decline in most of the City but a pocket of White growth where there was a massive new subdivision. There are obviously problems with sprawl but the data solidifies my observation that new market rate construction is needed to maintain a stable White population, and that it tends to both “diversify” the population proportionally but maintain the White population numerically.
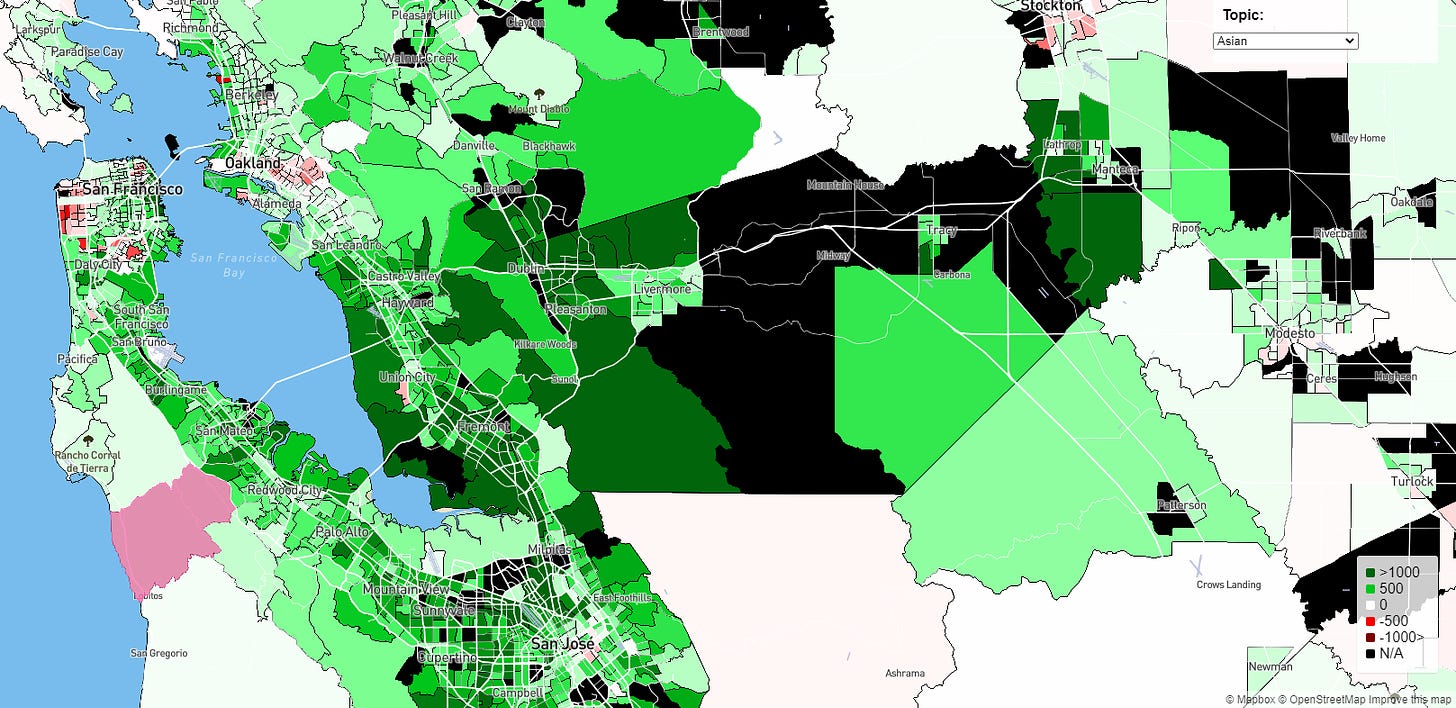
Bay Area’s Asian Population Growth
Source: Darrell Owens’ interactive map
Over the past decade California’s Asian population grew by 25%, the state’s fastest growing ethnic group, and Asians become a plurality in the Bay Area counties of Alameda and Santa Clara, a first for any county in California. Santa Clara County saw the biggest jump in its Asian population, “which rose from 31.7% in 2010 to 39% last year”, followed in growth by Alameda County and San Mateo County. During the 2010s the SF metro’s Asian population grew an astonishing 298,584 (66.9%) and the San Jose metro’s by 188,824 (92.2%), as Asians dominate new immigration to the Bay Area. The largest sources of new immigrants to the SF metro from 2010-2019 were from India (70,580), China (34,080), and Afghanistan (12,187). Adding to the Asian diversity, immigration from Vietnam grew by 9,043, and from Nepal by 6,446. For San Jose’s metro the top sources of immigrants were from China (50,250), India (45,224), and Vietnam (10,663).
Massive Asian growth is impacting most of the Bay Area with especially impressive growth in the suburbs. There is noticeable high Asian growth in Southern Alameda County but also in the traditionally Whiter suburban areas throughout the Bay Area, albeit more modest growth in Marin. Asian growth was more modest in urban areas and the Asian population actually declined in much of Oakland, the northeastern urban core of SF, including part of Chinatown, and SF’s Westside which includes the Richmond district. The Richmond District is a rare example of a neighborhood where Whites growth surpassed Asians, reflecting a broader trend of White professionals embracing urbanism as the Asian population suburbanizes. For instance Asian residents have recently been at odds with SF’s regressive public school system.
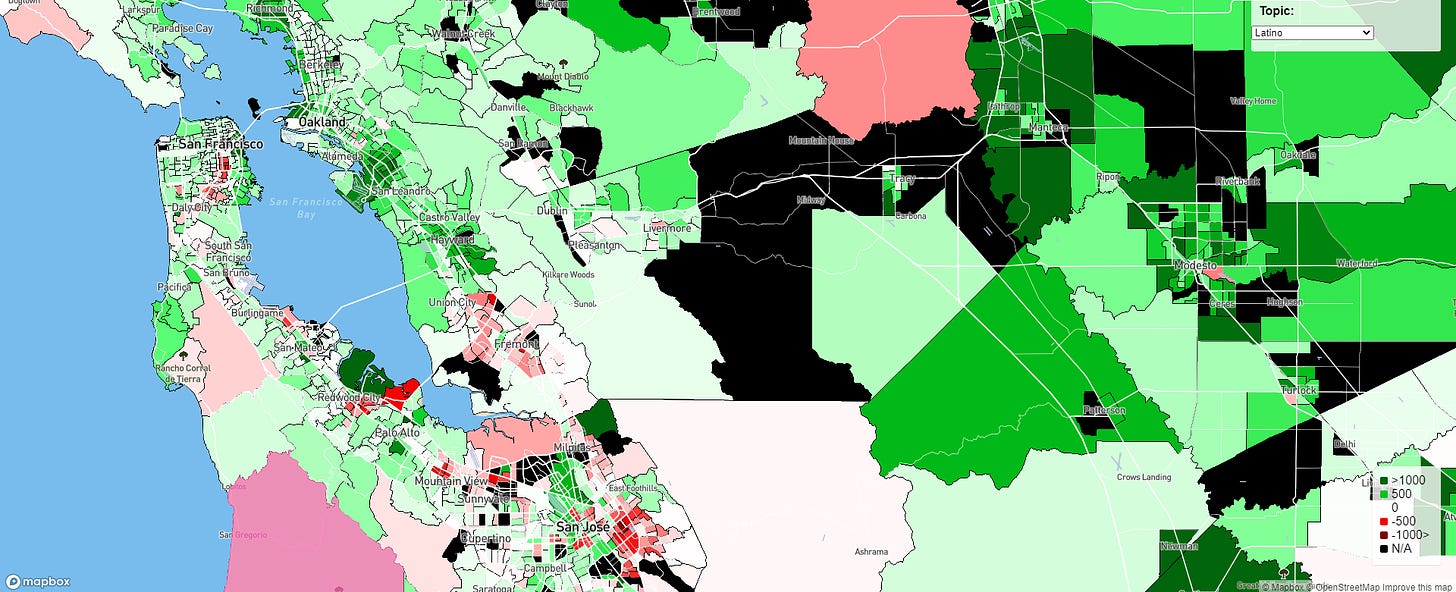
Bay Area’s Latino Population Growth
Source: Darrell Owens’ interactive map
Hispanics have been a plurality in California since 2014 and grew by 11% statewide, making up almost 40% of Californians. The Bay Area’s share of Latino residents grew overall with the exception of Santa Clara and San Mateo counties, declining from 26.9% to 25.5% in Santa Clara County. The Bay Area’s largest increase in its Latino population was in Marin County, where is grew three points to18.8%. The SF metro’s Latino population grew by 147,412 (33.1%) and the San Jose metro’s by a more modest 16,202 (7.8%). Overall the Bay Area’s Latino growth is much slower than the rest of the state. There has been significant Latino decline in historically Latino areas of SF’s Mission District, East San Jose, and in Redwood City, due to gentrification. Areas with the most significant Latino growth include Marin County, Richmond, the Eastern End of Oakland, and the working class exurbs of Eastern Contra Costa County such as Antioch.
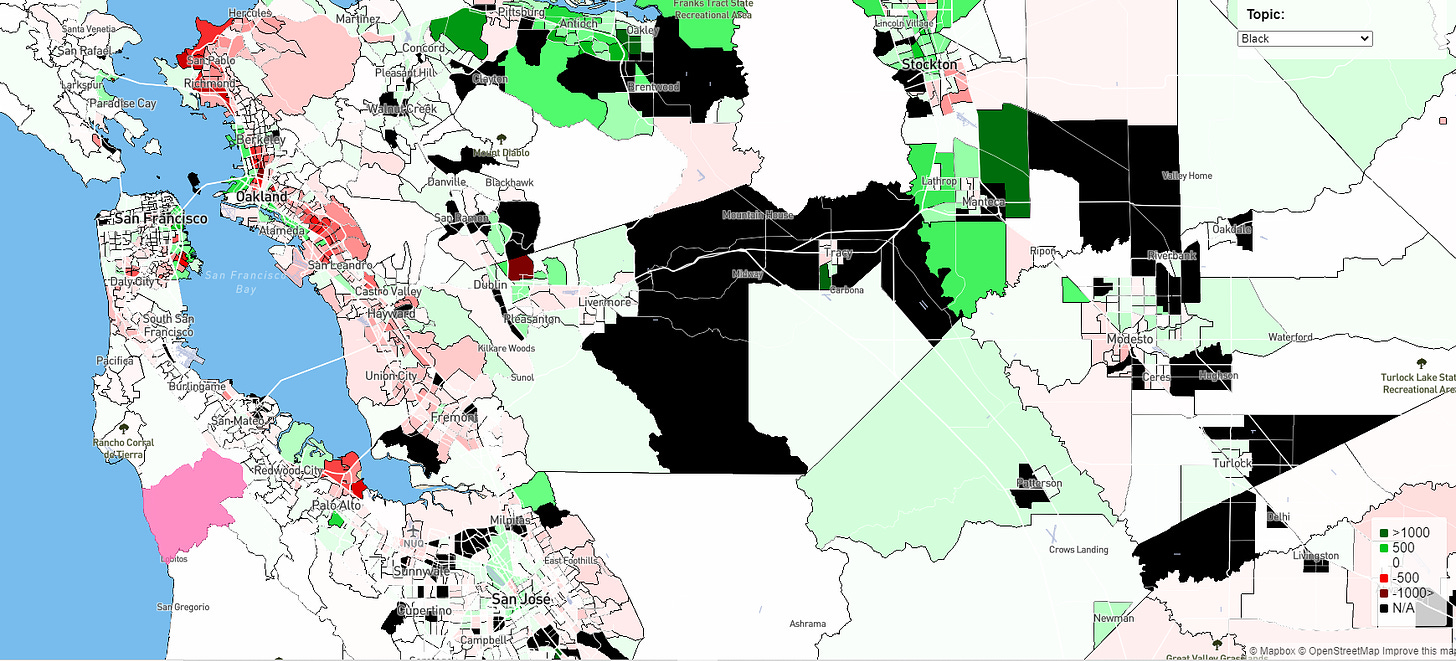
Bay Area’s Black Population Growth
Source: Darrell Owens’ interactive map
The share of Black residents fell in all the main Bay Area counties, with the biggest Black decline in Alameda County, where Blacks fell from 12.6% to 9.8%. In the 2010s the SF’s metro’s Black population fell by 26,510 while the San Jose metro’s Black population fell by 1,059. With some exceptions such as in high growth areas of Emeryville and SF’s South of Market, the Black population is plummeting in the Bay Area’s urban core, including historically Black neighborhoods in Southeastern SF, East Palo Alto, Oakland, and Richmond. Like the Latino population, Black growth is shifting towards Eastern Contra Costa County, with the city of Antioch known as New Oakland.
We see parallel trends in demographic displacement with White gentrification into working class Black and Latino urban areas and the massive Asian growth into traditionally White suburban strongholds. Both trends are driven by a combination of the 2010’s boom in new tech jobs on top of severe restrictions on new housing. In certain high growth areas such as Emeryville, and Mission Bay and South of Market in SF, all ethnic groups saw substantial growth, even if most new units were high end.
The SF Metro’s current demographic breakdown is 36.2% White, 27.2% Asian, 22.9% Hispanic, and 6.8% Black, and for the San Josee metro it is 37.8% Asian, 28.8% White, and 26.3% Hispanic. The Bay Area is close to achieving roughly an even number of Whites, Asians, and Latinos, with the White proportion close to the State average, while Asians are overrepresented and Latinos are underrepresented. In 2017 the Bay Area Equity Atlas (page 23) predicted that the Bay Area’s White population would go from 37% in 2020 to 24% in 2050, the Asian population from 27% to 32%, Latino from 26% to 33%, and Black from 6% to 4%. Besides the 2020 Latino estimate being off, I’m skeptical of the projected Latino growth being that much higher than for Asians. The Bay Area Equity Atlas (page 77) also shows that segregation is decreasing on a regional level but increasing on a group to group level.
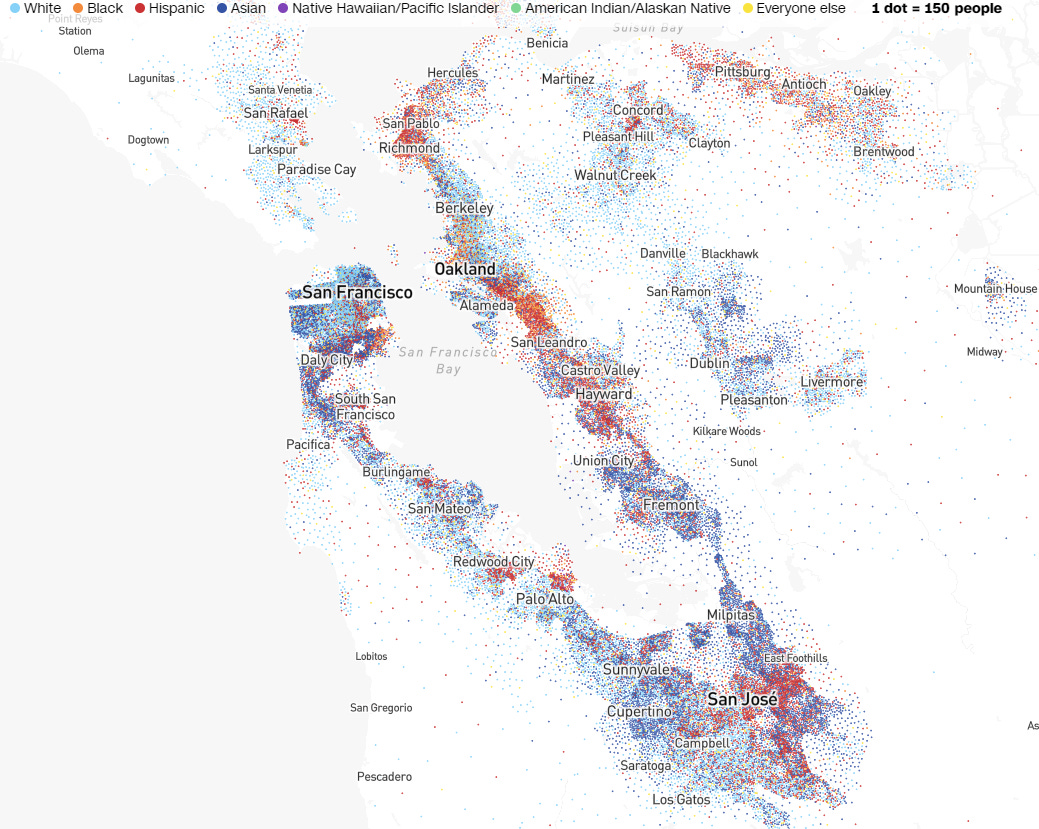
Source: CNN Interactive census map
The 2020 census race dot map solidifies my assessment of the Bay Area as a patchwork of many geographically defined ethno-regions. Whites are concentrated in Marin County, North-Central SF, the Peninsula and Southwestern end of the Silicon Valley, and Central Contra Costa County, Latinos in East San Jose, Redwood City, San Leandro, East Oakland, and Richmond, Asians in the Westside of SF, much of the Silicon Valley, and the southern half of Alameda County, with Blacks scattered into more diverse or heavily Latino areas in Southeastern SF, Oakland, Richmond, and Antioch.
The difficulties of making demographic projections, even if based on hard data, is the variable of factors that could shape future trends such as zoning, the economy, and immigration. California’s growth is heavily dependent upon immigration as fertility is below replacement level for all ethnic groups, including Asians and Latinos. If immigration were entirely cut off, the Bay Area would likely see Asians, whose fertility in the region is abysmally low, decline within a decade. If we were to assume a continuation of policies and political and economic trends of the 2010s, of massive tech job growth plus maintaining restrictive zoning continues, then we would see growth dominated by Asians, who are the majority of the Bay Area’s tech workforce since 2010, squeeze out the Bay Area’s White and Latino populations. Latino growth would likely start declining if single family zoning is not reformed.
However this prediction neglects that trends are influx and unpredictable. Even though the pandemic tech exodus was more modest than anticipated, I don’t expect the Bay Area to experience the same degree of tech job growth this decade. There are signs that we could see another dot com bubble crash and at the very least, remote work will enable tech companies to relocate jobs to more affordable regions to cut costs. I also expect the Bay Area to increase the number of new housing units, as Governor Newsom signed the zoning reform bills Sb9 and Sb10 into law, right after the recall was defeated. The implementation of Sb9, which ends single family zoning, plus a more decentralized tech sector will not only ease the cost of housing but established a new paradigm in the Bay Area.
I expect the Bay Area to continue changing demographically, but this new paradigm will better maintain a balance in growth between Whites, Latinos, and Asians. For instance sb9 allows for fast growing Asian ethnoburbs to grow via densification, rather than displacing Latino and White areas. While sb9 impedes local control and will diversify many neighborhoods, it is a net positive in the potential for all groups to thrive and grow at a healthy pace, while coexisting.
My prediction for the Bay Area’s demographic future is that we will see a pan-Asian region, making up the bulk of the Silicon Valley, Southern Alameda County, and much of San Mateo County. I predict that Whites will remain demographically dominant in Marin County for the foreseeable future, that the Whiter areas of the Peninsula, and Silicon Valley could transform into blended White/Asian communities, and that Central Contra Costa County could go either way, a White enclave or a blended White Asian area. Taking into account factors such as the White population being disproportionately elderly, my speculation that Whites who want to leave have already, and the impending implementation of sb9, I predict some stability in the White population in the long term.
San Francisco appears to be in decay but still has many attributes that make it desirable. There was a prediction that SF could become much Whiter while the rest of the region becomes more “diverse.” While this prediction reflects White techies relocating to SF in the 2010s, it is somewhat relevant, as Asians are abandoning the City while Whites are more willing to pay a premium for urban or aesthetic attributes.
I expect the Bay Area’s Black population to continue to dwindle and be relegated to the far out exurbs of Eastern Contra Costa County unless Bay Area cities become aggressive about maintaining their Black populations on social justice grounds. SB9 could help maintain the Black population numerically, but I still expect to see the further demise of demographically dominant Black enclaves. I also expect Sb9 to help maintain the Latino population numerically, but that Latino growth will continue to shift to cheaper inland areas of Eastern Contra Costa County, Solano County, and to the Central Valley. Many Latino majority areas in the Bay Area will continue to become more Asian as well.
To predict the demographic future of a region, one must factor in, both existing demographic trends and speculate about potential trends based upon policy. Besides trends in immigration and the economy, there are demographic cycles that must be taken into account, in that the fastest growing group now may not be in the future. I have predicted a future of pan-enclavism in California and while it seems that certain areas are diversifying, in many cases it is more a shift towards one group over another. The era of the late 20th Century to early 21st Century was unique in that we undergone a major demographic transformation, due to a number of factors including rapid economic growth, but I don’t expect an indefinite demographic transformation and for things to settle down into more established enclaves.


