Originally published on Unz in 2021. I plan on writing an updated version at some point.
California’s population growth is at its lowest recorded level since 1900 adding “just 21,200 residents” in the fiscal year that ended on July 1, which was just a “0.05% increase.” This decline is in large part due to the post-pandemic exodus on top of an already rapidly ageing population.
The average fertility rate for Californians was just 1.60 in 2019 compared to 1.71 for the US and the rates for 2021 will likely be even lower due to the pandemic and bleak economic prospects. Like California’s, America’s population growth as a whole has slowed to a crawl with an expected 300,000 to 500,000 fewer births in 2021.
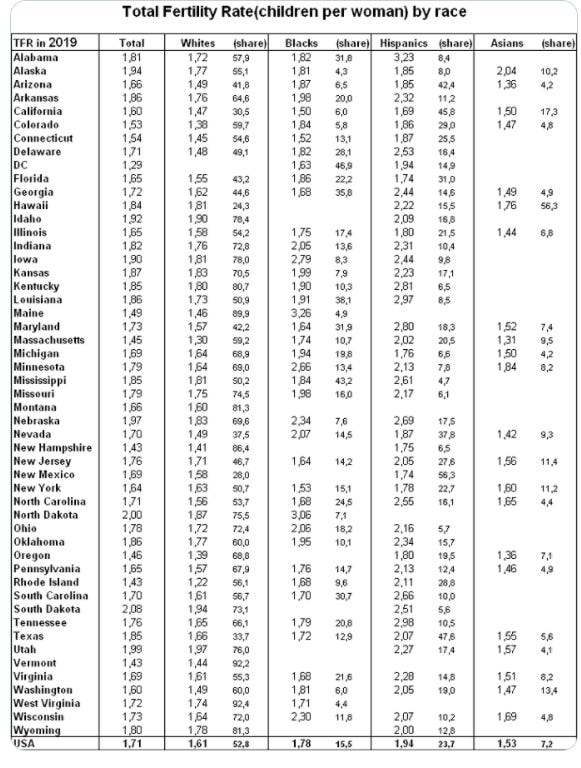
While there is a general perception that fertility rates are just low among Whites but still relatively high among non-Whites, the trend in declining fertility impacts all races with birthrates plummeting among Hispanic, falling by “by 31 percent from 2007 to 2017.” Hispanic Birth Rates have declined even more steeply than non-Hispanic Birth Rates but are still high in southern States, such as a Totally Fertility Rate (TFR) of 3.23 in Alabama, where the Hispanic immigrant demographic is fairly recently arrived.
The racial disparities in fertility have also narrowed. For instance in 2007 there was a TFR of 1.91 for Whites, 2.14 for Blacks, and 2.84 for Hispanics with a White/Black ratio of 1.12 and a White/Hispanic ratio at 1.49.
By 2015 US White fertility was at 1.75, Black at 1.86, and Hispanic at 2.12 with a White/
Black ratio of 1.06 and a White/Hispanic ratio of 1.20.US Fertility (2019):
Source: Chart from Birth Gauge on Twitter with data from the Wonder database of the CDC.
-For Whites there was a fertility rate of 1.47 and a share of 30.5% for California compared to 1.61 and a share of 52.8% for the US.
-For Asians there was a fertility rate of 1.50 and a share of 17.3% for California compared to 1.53 and a share of 7.2% for the US.
-For Blacks there was a fertility rate of 1.5 and a share of 6.0% for California compared to 1.78 and a share of 15.5% for the US.
-For Hispanics there is a fertility rate of 1.69 and a share of 45.8% for California compared to 1.94 and a share of 23.7% for the US.
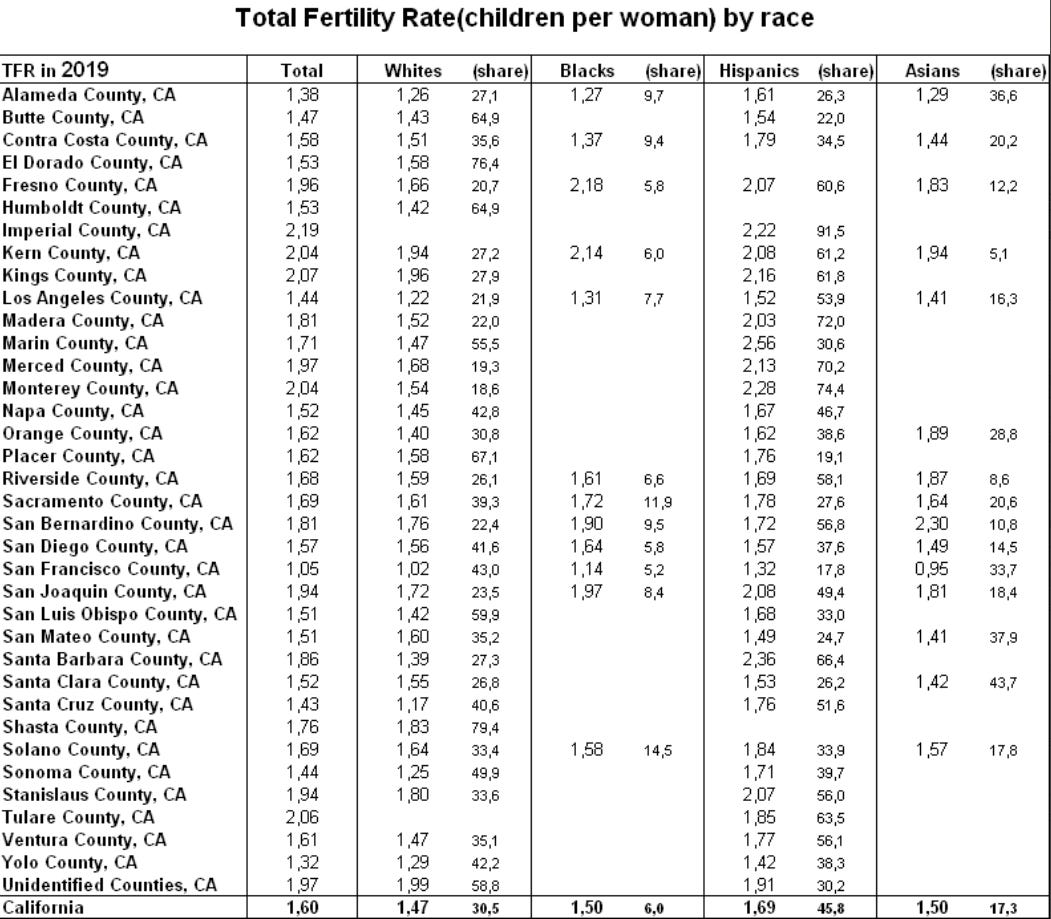
California Fertility (2019):
Source: chart from Birth Gauge on Twitter with data from the Wonder database of the CDC
California’s birthrates have plunged to a record low which is particularly concerning, as the state has long set national trends. Fertility rates in California are well below replacement level for all racial categories with racial disparities in fertility more extreme on some county levels than on a state level. The main reason for California’s demographic transformation is not fertility rates but rather new immigrants from Asia and Latin America.
The US and California had a Latino baby boom in the 90s and 00s but rates have since declined, mirroring trends among others demographics. The exodus out of California, long disproportionately impacting Whites and Blacks, has more recently impacted Asians and Latinos. Now many of California’s Mexicans are returning home or moving to cheaper states such as Texas due to a lack of employment during the pandemic.
Source: Wikipedia
From 2013 to 2018 in California, Blacks saw the biggest decline in the number of births by 30%, Whites saw a decrease of 14.2%, Asians of 10.4%, and Hispanics of 11.4%.
Even with high immigration levels the sheer numbers of births have declined among all racial categories, including Asians and Latinos. Despite declining fertility rates, Latinos still made up almost half of births and over half of California’s population growth.
The decline in Latino fertility in California and nationwide was sharpest after the housing bubble bust as Latinos were hard hit by the foreclosure crisis. Latino birthrates are especially low in urban counties with rates of 1.32 for San Francisco and 1.52 for LA County.
Latino fertility is still fairly high in agriculture-centric counties such as Santa Barbara at 2.36, Monterrey at 2.28 and in wealthy Marin at 2.56. Marin County’s Latino population is disproportionately Guatemalan rather than Mexican, Guatemala is a nation with one of the highest fertility rates in the Western Hemisphere with many Guatemalans working as a service class for wealthy homeowners in Marin. There has also been a dramatic increase in migration from Guatemala and other Central American nations in contrast with declining immigration rates from Mexico.
Latinos make up a majority of births in most of Southern California and the Central Valley counties with lower shares in the Bay Area, Sierras, and far Northern portion of the State. Among majority Latino Cities in California the proportion of the population that was under 18, as of the 2010 Census, was generally in the range between the 25th to early 30th percentile.
For Latinos there is a notable class disparity in fertility. In more middle class majority Latino cities such as Montebello (medium household income of $47,562) 25.8% of the population was under the age of 18, in Whittier (medium household income of ($65,583) 25.4%, and in Downey (medium household income of $60,374) 26.8%.
The share of the population under 18 was still fairly high in poorer agriculture-oriented majority Latino cities such as Mendota (medium household income of $25,229) with 33.9% of the population under the age of 18 and Soledad (medium household income of $46,010) with 36.7% under 18. East LA had a population share of 31.5% in 2010 in contrast with 2000 when East LA had a share of 34.6% that was under 18.
It is notable in Los Angeles County that despite Latinos having a low fertility rate of 1.52 they still make up a majority of births at 53.9%. The statistics of the population share under 18 were from 2010 and will likely be lower when the 2020 census data is released.
Asians are California’s fastest growing demographic group and in the 2010s China surpassed Mexico as California’s top source of new immigrants. With lower fertility rates, the Asian population growth is almost entirely due to immigration, both nationally and in California.
Among California’s majority Asian Cities there is a remarkable uniformity in the population share under 18. As of 2010, the share was within the range of 20-23% in the cities of Rowland Heights, Walnut, Cerritos, Temple City, Diamond Bar, Rosemead, Arcadia, and Milpitas. Among majority Asian cities the lowest share was in Monterey Park at 18.1% and the highest in Camino Tassajara at 36.4%, a city notable for having a lot of new construction.
Asian fertility rates are abysmally low at 0.95 for San Francisco and 1.29 for LA County. San Francisco’s Asian population is heavily of Chinese decent, comparable to low fertility regions of Hong Kong, Singapore, and Taiwan. If SF Asians were their own nation they would be tied with Macao and South Korea for having the world’s lowest fertility.
San Bernardino County stands out as having a notably high Asian fertility rate at 2.30. Besides being more affordable, San Bernardino County has an Asian population that is primarily Filipino, a nation which has one of the highest fertility rates in Asia.
Despite low fertility rates, the share of Asian births are highest in Santa Clara County at 43.7%, Alameda County at 36.6%, and San Francisco County at 33.7%, demonstrating that immigration has compensated for low Asian American fertility.
However many recent Asian immigrants are now more likely to settle in other parts of the nation than California. Also China having brighter economic prospects than the US could lead to a dramatic reduction in immigration similar to the decline in immigration from Korea and Taiwan which peaked in decades past, and has been in decline ever since. US politicians, however, have proposed granting refugee status to Hong Kong Chinese and India, which still has a relatively high fertility rate, will likely see immigration to the US increase.
California’s Blacks have had an exodus out of the state and contrary to stereotypes have relatively low fertility rates. The most abysmally low Black fertility rates are in San Francisco at 1.14, Alameda at 1.27, and LA at 1.31. Notably high Black fertility rates are in Fresno County at 2.18 and Kern County at 2.14. The Black share of births is overall low in California but the highest is in Solano County at 14.5%.
Black birthrates have decline nationwide and are converging with White rates, especially among Foundational Black Americans who have much lower rates than immigrant Blacks. Rates are only still high among African immigrants who make up a very modest share of California’s Black population. For instance the nation’s highest Black fertility rates are in North Dakota at 3.06 and in Maine at 3.26, states whose Black populations are primarily of foreign origin.
Among Whites the lowest fertility rates are in San Francisco at 1.02, Santa Cruz at 1.17, and LA County at 1.22, places known for their liberal politics and high housing costs. The highest White fertility rates are in Shasta at 1.83, Kern at 1.94, and Kings at 1.96 as well as in unincorporated counties-which are smaller sparsely populated counties- at 1.99. Overall these are counties that are rural, much less affluent and have more conservative political leanings.
The White share of fertility is abysmally low in LA, the Inland Empire, much of the San Joaquin Valley, and Monterrey County which has the lowest share of White births at only 18.6%.
There is a narrative about the increase in diversity reducing the White TFR, but in Kern County (1.94/27%), Kings County (1.96/27.9%), and San Bernardino County (1.76/22.4%) Whites have low shares of overall births but decent fertility rates. Access to spacious and affordable housing seems to be the key and conservative politics are a factor as well.
Counties where Whites are still the majority of births include Marin (55.5%), San Luis Obispo (59.9%), much of the far northern portion of the state including Shasta (79.4%), Placer (67.1%) and Eldorado county (76.4%) in the Sierras and in unincorporated counties at 58.8%.
Among majority White cities the highest share under the age of 18, as of the 2010 census, include middle to upper class LA suburbs of Moorpark (27.5%), Glendora (27.6%), Stevenson Ranch (32.2%), and Hidden Hills (28.6%), well-off Bay Area suburbs of Pleasanton (27.1%) and Piedmont (28.3%), middle class Fresno suburb Clovis (28.1%), working class agricultural town in Butte County Gridley (28.7%), middle class Central Valley city of Ripon (28.8%), Sacramento suburbs of El Dorado Hills (29.5%) and Plumas Lake (36.6%), Riverside suburb of Temecula (30.7%), Bay Area exurb Brentwood (31.2%), and upper-middle class Orange County suburbs of Rancho Santa Margarita (29.0%) and Yorba Linda (29.3%). Ladera Ranch in Orange County stands out with an impressive share of (38.3%) under 18, higher even than most majority Latino cities.
These higher fertility majority White cities are economically diverse but what stands out is that most have a significant supply of new housing construction with many master planned communities such as Plumas Lake, Rancho Santa Margarita, Ladera Ranch and Stevenson Ranch.
The White share of the demographics of these city’s school districts ranges from 54.5% for Temecula, 55.0% for Clovis, 56.3% for Capistrano Unified which includes both Rancho Santa Margarita and Ladera Ranch along with a number of other cities, and 74% for Piedmont
Majority White cities with abysmally low shares under the age of 18 include well off urban cities of West Hollywood (4.6%), Berkeley (12.3%), and Santa Monica (14.0%), well of suburban cities such as Sausalito (8.7%), Stinson Beach (12.0%), Del Mar (13.6%), and Hermosa Beach (15.9%), the middle class suburb of Seal Beach (13.0%), wealthy cities outside of major metros such as Carmel-by-the-Sea, (10.2%), Rancho Mirage (10.6%), Inverness (10.7%), Avilla Beach (11.2%), San Luis Obispo (12.2%), Bodega Bay (12.2%), Sunnyside-Tahoe City (12.3%), Pismo Beach (13.3%), Palm Springs (13.7%), Santa Cruz (13.7%), Summerland (14.6%), Morro Bay (15.0%), and Monterey(15.3%).
The trend for these low fertility locales tends to be urban areas with expensive real estate but poor quality schools, suburbs with older housing stock, or resort and retirement destinations that lack access to high paying jobs.
There is definitely a strong anti-natalist sentiment among older liberal NIMBY’s with Santa Monica NIMBYs trying to block a pre-school in their neighborhood and Silicon Valley NIMBYs suggesting young families should leave the area.
The only two counties where Whites have fertility rates above their county’s average are San Mateo which has a White share of 35.3% but a fertility rate that is 105.9% of the county’s overall fertility rate and Santa Clara with a share of 26.8% but 101.9% of the county’s rate. Even though the White shares of births are much lower than the White share across all ages the fertility rates are higher than the overall rate. These two counties are the only in the State where the White rates are actually higher than the Latino rate (Santa Clara: Whites at 1.55 vs. Latinos at 1.53 and San Mateo: Whites at 1.60 vs. Latinos at 1.49). The Bay Area’s Latino growth has stalled due to the high cost of living, especially in the Silicon Valley.
Daly City which is the largest city in San Mateo County and majority non-White has a low share of the population under 18 at just 19.4%. Daly City is fairly middle class in contrast with East Palo Alto which is much poorer and has a high share at 31.9%.
The well off majority White cities in San Mateo County rang somewhere in between, from San Carlos with 23.6% of the population under 18, Atherton at 22.3%, and Menlo Park at 24.4%. This reflects a J-shaped trend in fertility for class in these two counties where Whites have the highest per capita income.
Whites in this region tend to be well established home owners while Asian immigrants include rank and file tech workers who are disproportionately single adult renters and also Asian and Latino fertility is crushed by the astronomical rents.
The counties where the White rate is very close to the state average include Contra Costa at 95.5% of the total rate, San Bernardino at 97.2%, Placer at 97.5%, San Francisco at 97.1%, Yolo at 97.7%, and San Diego at 99.3%.
For San Francisco the rates are abysmally low for all races due to the high cost of living, and Asians rather than Latinos being the largest non-White share. For the most part these counties are California’s Suburban White flight zones.
For Bay Area suburban Contra Costa County, the share of the population under 18 was decent in many of the well-off majority White suburbs with Blackhawk at 24.3%, Clayton at 24.4%, Lafayette at 24.9, Orinda at 25.6%, Alamo at 25.7%, Danville at 26.6% and Brentwood at 31.2%. In comparison the lower income urban majority non-White city of Richmond had a share of 24.9% under 18, a tie with wealthy majority White Lafayette.
While Contra Costa was an early White flight region, Placer County has become California’s top destination for White flight. Among Placer’s top cities, which are majority White, the share under 18 was decent with Roseville at 26.3%, Rocklin at 27.4%, Lincoln at 24.2%, Granite Bay at 26.0%, and Auburn at 26.1%.
With San Diego County, the largest city after San Diego—the majority Hispanic, Chula Vista —had a share of 27.9% under the age of 18 which is only modestly higher than the very White cities of Carlsbad at 24.1%, Ramona at 25.9% and Poway at 25.0%.
As for under-representation between the White and overall fertility rate, the most extreme disparities are in Monterrey County where White fertility is 75.5% of the total fertility rate, Santa Barbara County at 74.7% of the total rate, LA County at 84.7% of the total rate, Fresno County at 84.7% of the total rate, and Marin County where White fertility is 86% of the total rate.
Monterrey County’s well off majority White cities’ share under 18 is very low with Pacific Grove at 16.5%, Carmel-by-the-Sea at 10.2%, and Monterey at 15.3%. In contrast the majority Latino agricultural communities of Soledad had a share of 36.7% and Salinas a share of 31.4% under 18.
Santa Barbara County has the same trend with the largest city, which is majority Hispanic, Santa Maria having a share under 18 of 31.4%. In contrast the well-off majority Whites cities have much lower shares with Summerland at 14.6%, Santa Barbara at 18.6%, Mission Canyon at 15.5%, and even the ultra-wealthy Montecito at only 16.9%.
It is also noted that Santa Barbara’s school district’s demographic is only “32 percent white” with “58 percent socioeconomically disadvantaged.”
Many of these wealthy cities are resort or retirement destinations and don’t have access to high paying jobs but are still dependent upon a large service sector.
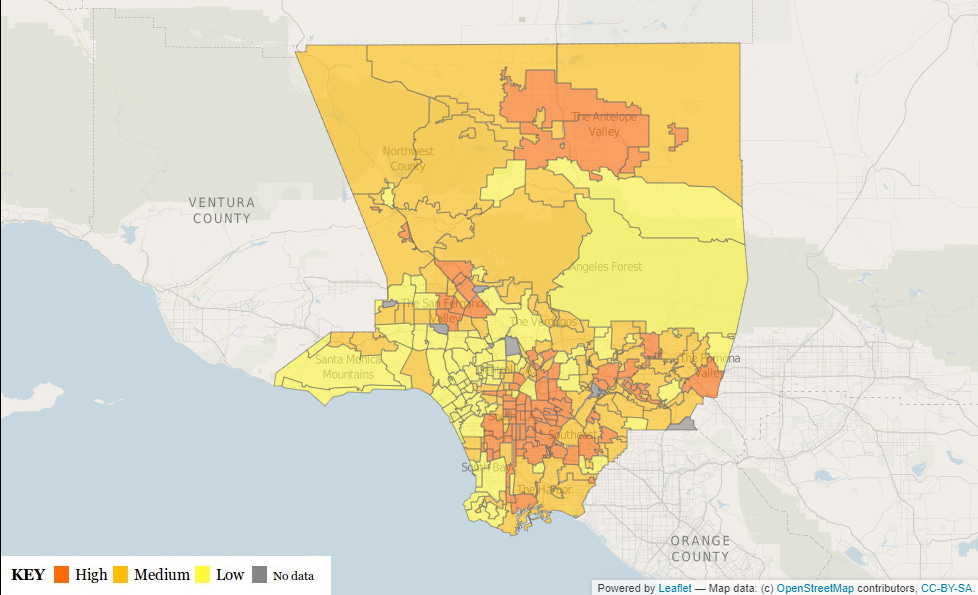
Population of LA County 10 and under (2009)
Source: LA Times
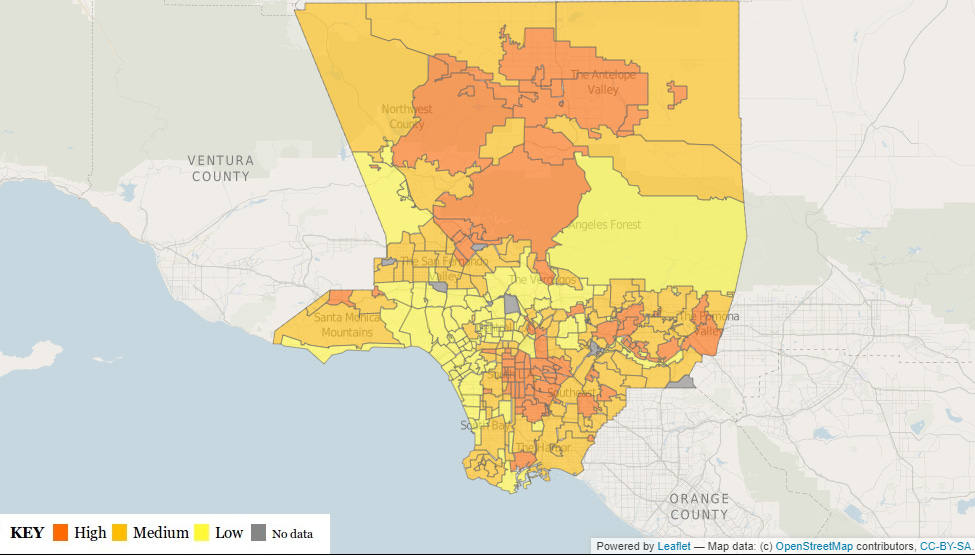
Population of LA County 11 to 18 (2009)
Source: LA Times
In LA the share of the population age of 10 and under and 11-18 is overall highest in lower income majority Latino neighborhoods including much of South and East LA. Watts came in at number one for the share of the population that is 10 or less, Historic South-Central and Compton were very high too, and Boyle Heights and East Los Angeles also made it in the high category.
The lower income majority Latino neighborhoods of Van Nuys, Panorama City, and Pico-Union went from medium to high and Westlake, near Downtown LA, went from low to high from the category of ages 11-18 to 10 and under. This is largely due to the surge of Central American immigrants into the Pico-Union/Westlake area and the poorer parts of the San Fernando Valley. Central American immigrants have much higher fertility rates than Mexicans/Mexican Americans.
These statistic are from 2009, reflecting the 00’s Latino baby boom, but fertility rates have declined in the 2010s with middle class Hispanic areas such as Canoga Park , Montebello, Downey, Whittier, North Whittier being in the medium category. This demonstrates a clear trend of fertility declining as Latinos become upwardly mobile.
Much of the Western portion of South LA which is heavily Black rather than Latino has much lower fertility. Modest income Black communities are mostly in the medium category while well-off Black communities such as View Park-Windsor Hills and Ladera Heights have shares under 10 that are comparable to the affluent White parts of the Westside. As with Hispanics there is clearly a trend of Black fertility declining as income rises and the inverse relationship between fertility and educational attainment is more pronounced among people of color than among whites.
As pointed out earlier, majority Asian cities such as Rosemead, Rowland Heights, Diamond Bar, and Temple City are in the medium category with Cerritos moving from medium, in the 11-18 category to low in the 10 and under. San Marino, the wealthiest of these cities went from high to low from the 11-18 category to 10 and under. Monterey Park and Alhambra were low in both categories demonstrating the trend that Asian population growth is reliant upon immigration rather than fertility.
Most of the majority White neighborhoods on the Westside were in the low category for both 11-18 and 10 and under. The Unincorporated Santa Monica Mountains and Beverly Hills standout as medium for the 11-18 category but moved down to low for 10 and under while the Pacific Palisades moved up to the medium category from low. Beverly Hills was still modestly higher than its neighbors that are part of LA’s school district.
The flatlands of South Bay were low for 11-18 but Manhattan Beach and El Segundo moved up to medium for the 10 and under category while Redondo Beach and Hermosa Beach stayed in the low category.
The cities of the Palos Verdes Peninsula were medium for 11-18 but moved to low for the 10 and under category except for Rolling Hills Estates which stayed medium.
The upper class parts of the San Fernando Valley, that are part of LA’s school district, including Woodland Hills, Tarzana, Encino, Sherman Oaks, and Studio City were low for both categories.
Agoura Hills and Hidden Hills went from high to medium, Calabasas stayed medium, but Westlake Village went from medium to low. These communities are part of the wealthy Conejo Valley and stand out in contrast with the neighboring parts of the San Fernando Valley in having higher rates for both categories. The Conejo Valley is known for its high performing Las Virgenes school district and grew up as a reaction to school busing in the San Fernando Valley in the 70s and 80s.
The wealthier White areas that have decent rankings in the 10 and under category were Hidden Hills, Agoura Hills, Glendora, Calabasas, La Cañada Flintridge, Pacific Palisades, and West Hills, areas that tend to have the higher quality schools. For instance the very exclusive Pacific Palisades had a share 10 and under of 15.0%. compared to almost as wealthy neighboring Brentwood at just 8.7%. This is in large part due to the local schools with Pacific Palisades High having a demographic that is 51% White, only 32% of the student body coming from economically disadvantaged households, and a ranking of #54 for Los Angeles Metro Area High Schools.
This is in contrast with upscale Brentwood being served by University High, the author’s alma matter, which has a demographic that was just 8.6% White in 2009 and 12.8% White in 2018, a modest bump. 74% of University High’s students came from economically disadvantaged backgrounds, and the school had a ranking of #132 for Los Angeles Metro Area High Schools.
This trend is noticeable in further out, more middle class suburbs, which have decent schools. For instance Santa Clarita was in the medium category, and nearby Stevenson Ranch went from low to high. Stevenson Ranch is exceptionally high and ahead of even East LA and Boyle Heights in the 10 and under category.
While there are legitimate quality of life and ecological problems with sprawl there is clearly a natalist impact of large scale housing developments.
Overall the areas with the most abysmally low shares under 18 and 10 and under include Studio City, Santa Monica, West Los Angeles, Los Feliz, Brentwood, Venice, Century City, Playa del Rey, Hermosa Beach, , Sawtelle, Hollywood Hills West, Hollywood Hills, Marina del Rey, and Westwood. For the most part these are areas that are upscale but with lower quality public schools and a NIMBY mentality towards building new housing.
As wealthy boomers become empty nesters and younger generations in their prime child baring age have yet to get a foothold in these upscale areas, these trends will have exacerbated since LA Times’ 2009 neighborhood data.
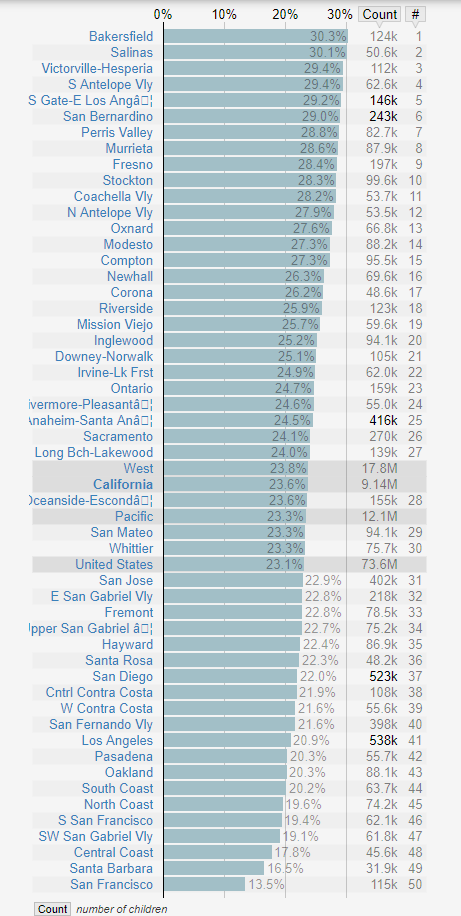
Percent of population under 18 in California:
Source: Statistic Atlas
Source: Statistic Atlas
Overall, the subregions that are higher in ranking among the under 18 share are poorer and majority non-White but there is a degree of nuance. The Top 15 regions were all lower income and majority non-White, including the agricultural regions of Bakersfield and Salinas, the exurbs of the inland empire, and the inner-city region of South Gate/East LA.
There is more nuance in that suburban middle-class Newhall (near Santa Clarita in LA County) is almost tied with Compton. The Mission Viejo region is fairly high too and about tied with Inglewood. The Mission Viejo region includes upper middle class White suburban cities referenced earlier such as Ladera Ranch and Rancho Santa Margarita. Noted the ultra-wealthy South Coast, nearby in Orange County was much lower than Mission Viejo.
The well off suburban region of Livermore/Pleasanton was modestly above the state average, the suburban region of Oceanside/Escondido was close to the California average, while the middle-income Latino region of Whitter was slightly below average.
The affluent majority White Central Contra Costa County was basically tied with the less affluent and more non-White and urban West Contra Costa County, and is significantly higher than the nearby heavily non-White, urban, Oakland.
Major urban areas range from Sacramento and Long Beach at slightly above the state average, to San Jose, LA, Oakland, and San Diego below the average, and San Francisco at the very bottom.
The North Coast, which is one of the state’s poorest majority White regions, and the more affluent Central Coast were fairly-low, while the affluent Santa Barbara region was abysmally low.
The North Coast includes some of The poorest majority White counties with Humboldt County at 19.5% under 18. Among lower income majority White North Coast cities, Arcata had a share of 12.6% under 18 and a medium household income of $30,244 and Crescent City had a share of 14.5% under 18 and a medium household income of $27,885.
Overall there is a trend of fertility declining as wealth increase s but unlike with non-Whites, the patterns in majority White cities in California lack any absolute fertility pattern based on wealth. The three things that seem to matter are new construction, large home sizes, decent schools, and political orientation. White people, in California and elsewhere, seem to have deeply-ingrained need to own a home before breeding.
It is clear that NIMBY policies that restrict housing reduce fertility with the housing market especially severe on first time buyers. This is caused by a limited supply due to both NIMBYism and high immigration levels putting further strain on the market.
Obviously there are strains on the working class but it also seems that the policies dominant in California act as population sinks reducing fertility even for the upper-middle class and wealthy due to costs for housing and education in expensive urban areas. The culture and policies of the State of California, we may conclude, are hyper-individualistic, not merely in the sense of the American over-valuation of “personal freedom”, but also in a much more negative and banal sense: the social and economic catering toward the atomized individual—as opposed to family, or tribe—as the basic unit in society.




Birth rates were already on the decline before the Covid vax. Dr. Wolf spoke of it here, on Substack. Thanks for the data!
https://onlinelibrary.wiley.com/doi/10.1111/andr.13209 and
https://vigilantfox.news/p/infertility-concerns-dropping-birth?publication_id=975571&post_id=81842427&isFreemail=true
How many kids do you have?